Figure 4.
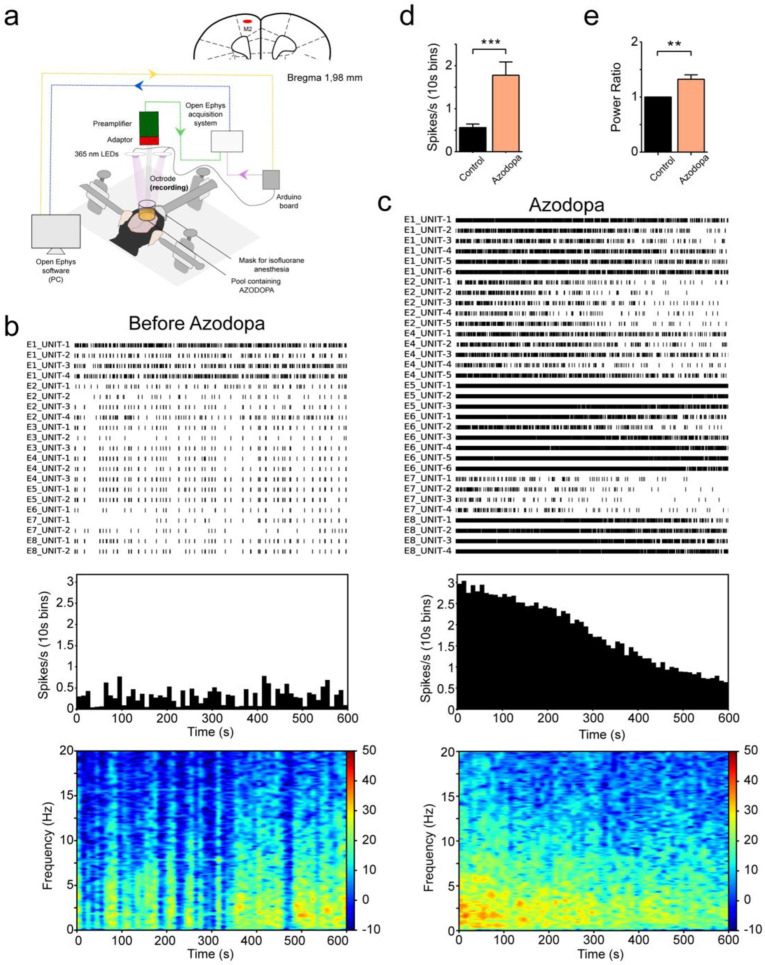
Effect of cortical administration of trans-azodopa on electrophysiological recordings in anesthetized mice. (a) Animals were anesthetized with isoflurane and placed in a stereotaxic apparatus. A craniotomy was drilled above the secondary motor cortex (M2) and an octrode was inserted in the superficial layers. Analogic signals were bandpass filtered and digitized by a preamplifier, amplified by an Open Ephys data acquisition system (green arrow), and finally visualized and recorded in a PC (blue arrow). Neural activity was recorded during baseline conditions and after administration of trans-azodopa on the cortical surface (3 μM concentration in 10 μL volume). See the Supplementary Materials for further details of the setup and supplementary Figures S17–S19 for the effect of illumination on azodopa. (b) Neural activity during baseline conditions in Mouse 1. Raster plot of spiking activity in the cortex of one mouse for 10 min. Each row depicts the spiking activity of a single neuron (unit), each tick representing an action potential. We used arrays of 8 electrodes (octrodes) in each animal, from which several units could be recorded. Neurons are labeled by their electrode number (E1 to E8). Firing rates were stable and followed the UP and DOWN slow fluctuations typical of anesthesia. The quantification of firing rates and average time–frequency spectrogram of the power of neural oscillations (n = 8 electrodes) are shown below. (c) Neural activity after the administration of 3 μM trans-azodopa in Mouse 1 (zero indicates the time of administration). Azodopa boosted the firing rate of neurons and increased the power of neural oscillations. (d) Azodopa increased spiking activity of cortical neurons. Mean firing rate of neurons before and after the administration of trans-azodopa. Data are mean ± S.E.M. (n = 44 neurons during baseline vs. 43 neurons after azodopa in two mice) and were analyzed with an unpaired T-test (*** p = 0.0002). (e) Azodopa increased the power (1–10 Hz) of neural oscillations in the two animals. Due to the large differences in the baseline power of the two mice, we normalized the power to its baseline for visualization purposes only. Data are mean ± S.E.M. (n = 16 channels per condition from two mice) and were analyzed with a paired T-test (** p = 0.0011).

