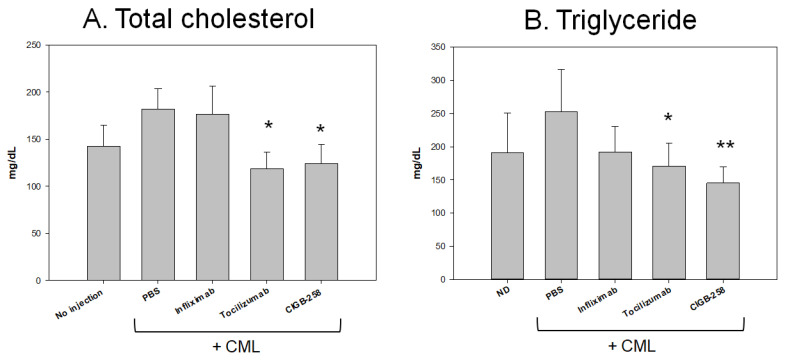
Figure 9.
Quantification of lipid profiles from zebrafish injected with PBS, CIGB-258, Infliximab, and Tocilizumab in the presence of carboxymethyllysine (CML). * p < 0.05 versus PBS (CML alone) group; ** p < 0.01 versus PBS (CML alone) group. All zebrafish were sacrificed at 60 min post injection of each designated drug. (A) Quantification of total cholesterol (TC) levels at 60 min post injection. (B) Quantification of triglyceride (TG) levels at 60 min post injection.

