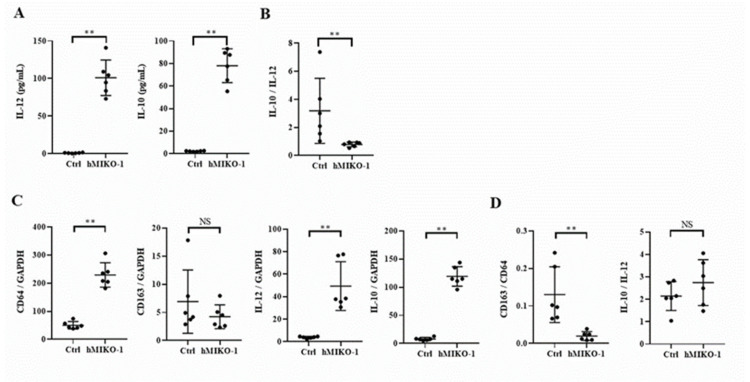
Figure 4.
Cytokine concentration in the culture supernatant and gene expression in murine macrophages. Culture supernatant concentrations of IL-12 and IL-10 (A) and the IL-10/IL-12 ratio (B). Relative mRNA expression of CD64, CD163, IL-12, and IL-10 (C) and the CD163/CD64 and IL-10/IL-12 ratios (D) in murine macrophages. hMIKO-1: hMIKO-1 co-culture group. Ctrl: Control group in which hMIKO-1 was not added. Data are shown as mean ± SD (N = 6 per group). ** p < 0.01, significant differences between the linked groups. NS: not significant.

