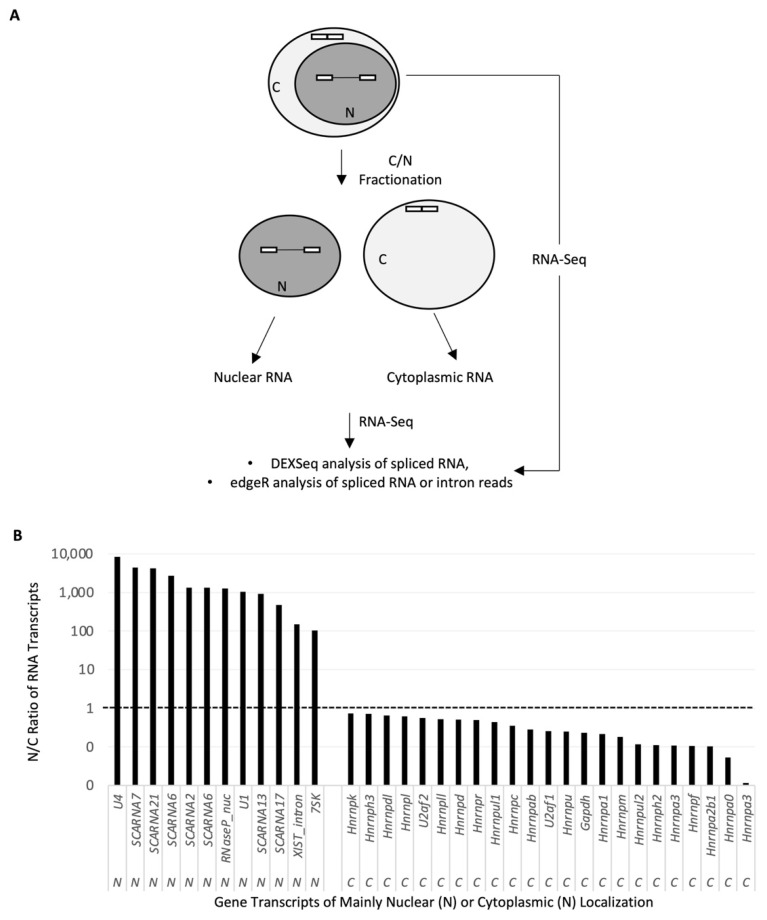
Figure 1.
RNA-Seq samples and workflow of analysis. (A) Diagram of the nucleo-cytoplasmic fractionation and subsequent analyses of the RNA-Seq data of RNA from different fractions. (B) Efficiency of the fractionation based on the nucleocytoplasmic (N/C) distribution ratios of the subcellular location-known RNA transcripts. Ratio determined by the edgeR analysis of the RNA-Seq data of nuclear versus cytoplasmic RNA fractions of KCl-depolarized samples.

