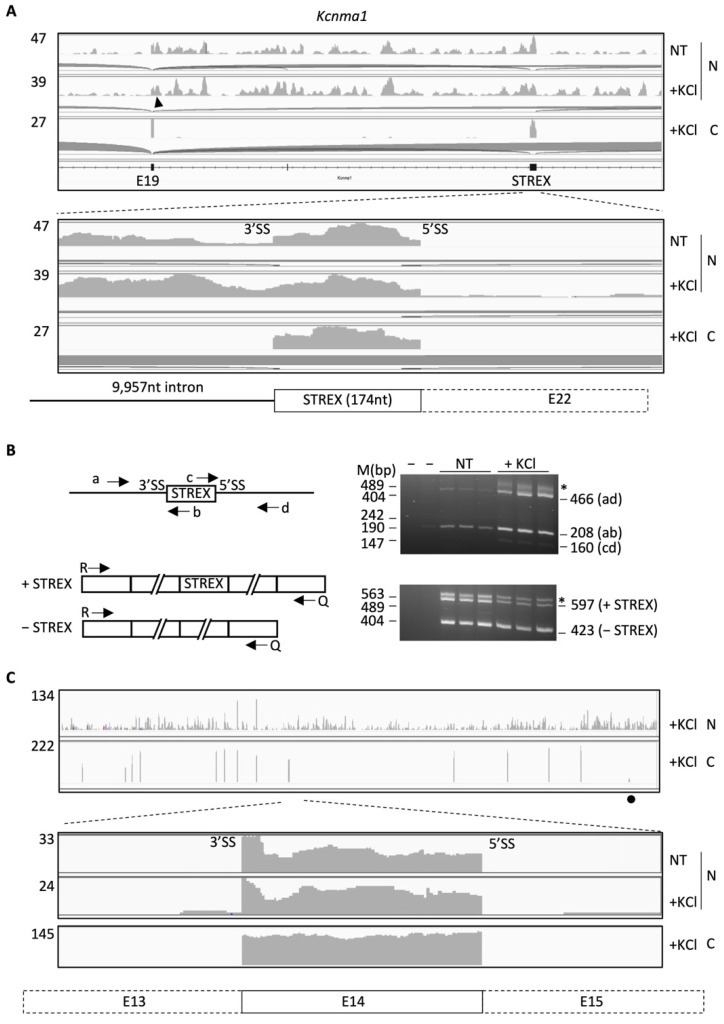
Figure 2.
Differential distribution of RNA-Seq reads at the intron start/end (splice site) of nuclear RNA transcripts. Shown are the pre-mRNA regions containing the alternative STREX exon in IGV views (A), RT-PCR products (B) or the constitutive exon 14 (C) of the Kcnma1 gene on chromosome 15 (Chr15: 911–927 kb) of the rat GH3 pituitary cells without (NT) or with KCl treatment. Under each enlarged view are deduced major patterns of spliced intermediates of the pre-mRNA transcripts in the NT samples. The curves extending from the exon start/end denote splice junctions. To the left of each IGV view is the upper limit of read counts for each sample. Arrowhead: upstream 5′ splice site also with read peaks. N: nuclear fraction, C: cytoplasmic fraction. Black dot: STREX. In (B), the RT-PCR was from total RNA of NT or KCl-treated cells for both pre-mRNA and spliced products. Arrowheads: PCR primers. Diagrams not to scale. Note that the R/Q primers for the spliced products span multiple exons/introns of the gene. The left two lanes are negative controls, PCR without cDNA and RT (KCl-treated) without reverse transcriptase, respectively. The RT control lane has a 208 bp band but is much weaker than the sample lanes (~5% of the band in the KCl-treated samples). *: heteroduplexes, with half of the band intensities added to each spliced variant for product calculations. M: DNA markers. Numbers to the right of the gels are the expected sizes of the PCR products.

