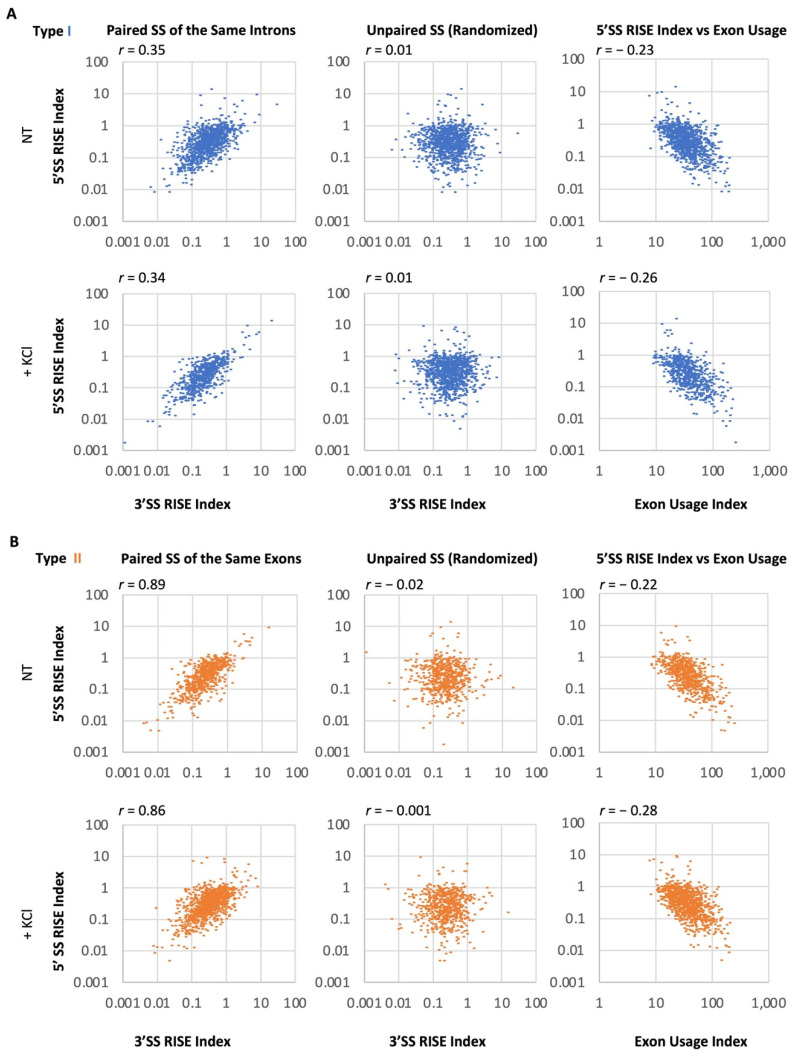
Figure 4.
Transcriptome-wide correlation of RISE indexes across introns or exons. (A) Scatter plots of the 5′ and 3′SS RISE indexes (Log10) across introns (left panel), randomized (middle), or of 5′SS RISE index versus the usage of adjacent exons (right), in NT (upper) or KCl-treated (lower) cells. n = 985 type I RISE. (B) Similarly, as in A, except across exons. n = 633 type II RISE. r: Pearson coefficient. Each index value is the mean of three samples.

