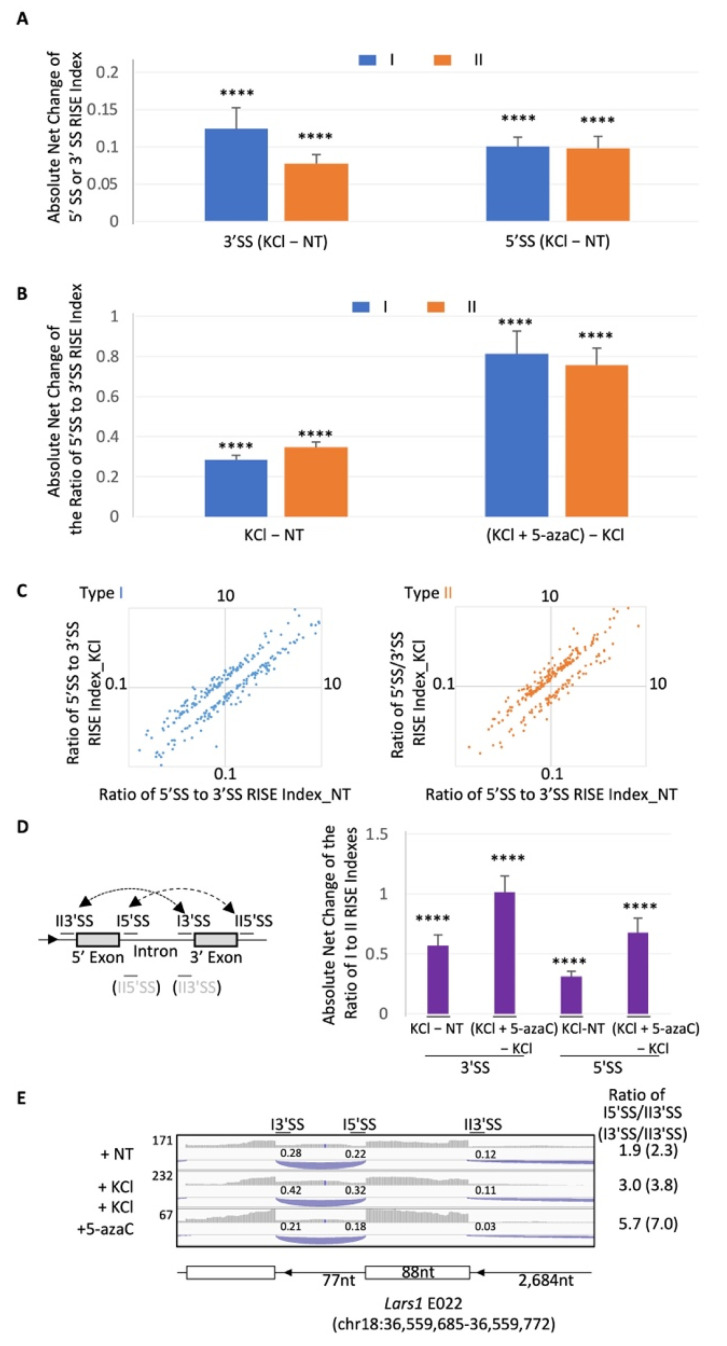
Figure 5.
Global changes of the RISE indexes and 5′SS/3′SS RISE index ratios by depolarization. (A) Absolute net changes (Mean ± SEM) of the indexes of 5′ or 3′SS RISE across introns (I, n = 803 pairs) or exons (II, n = 535 pairs) by KCl versus those in NT. (B) Absolute changes (Mean ± SEM) of the ratios of 5′ versus 3′SS RISE indexes. (C) Scatter plots (Log10) of the 5′SS/3′SS ratio changes of RISE pairs by KCl, by more than 20% of the NT samples in (B) (n = 266 and 254 pairs for types I and II, respectively). (D) RISE index shift between the type I and II by KCl. Left, a diagram of an example of type I mixed with either a 5′ or 3′ type II RISE pairing, with the splice sites labeled as in the graph to the right. Note that the I5′SS or I3′SS, thus labeled after type I SS for simplicity, can also be type II 5′SS or 3′SS (in grey), respectively. The dash lines with arrows denote the shift directions, which could be either way by KCl (vs NT) or 5azaC (5azaC + KCl vs. KCl). Arrowhead: gene direction. Right, absolute net changes (Mean ± SEM) of the I3′SS/II3′SS or I5′SS/II5′SS RISE ratios when the 5′ or 3′ exon is involved in both types I and II, respectively. n = 178, 178, 147 and 147, from left to right. (E) An example of the effect on the RISE indexes by KCl-depolarization and 5-azaC for those in (B) and (C): Diagram of the Lars1 exon E022 and its downstream intron with both types I and II RISE pairing, with indicated average indexes of RISE as well as their index ratios of I5′SS/II3′SS (type I pairing RISE) or I3′SS/II3′SS (type I or II RISE). Arrowheads on introns: gene direction. ****: p < 0.0001, one sample t-test of the population Mean value of net changes against the hypothesized value of 0 (no net changes).

