Figure 1.
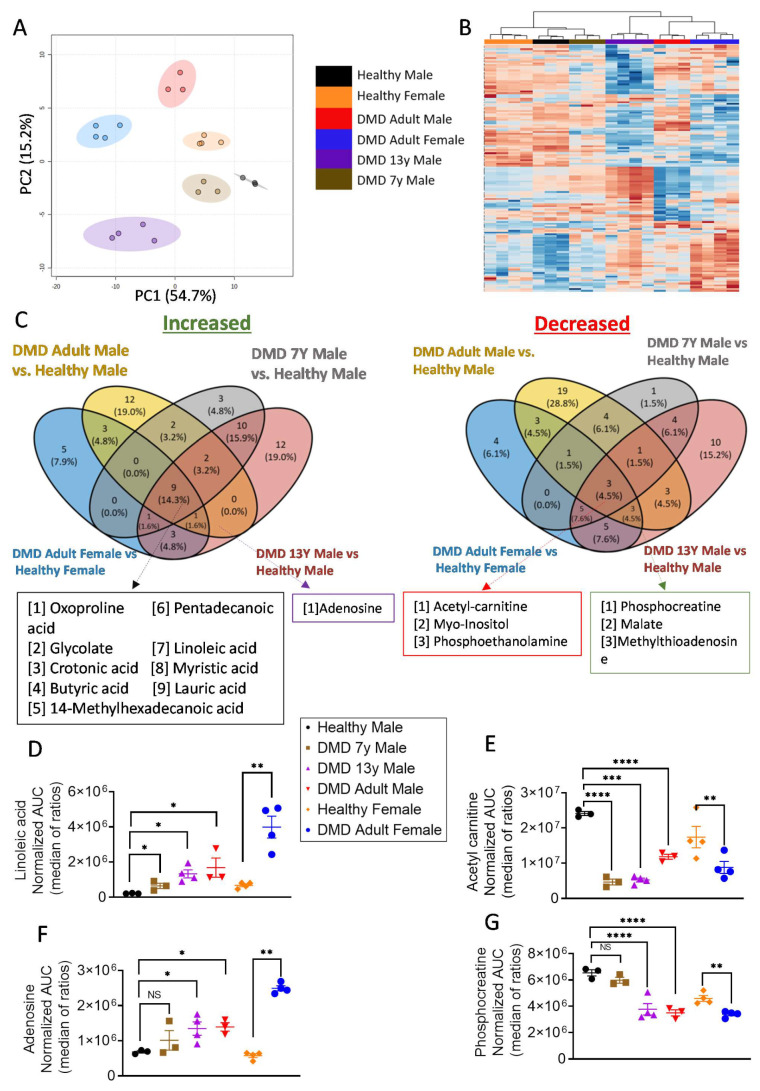
Metabolomics analysis of iPSC-CMs. (A) PCA of 1700 chromatographic feature intensities for iPSC-CMs, colored by group: DMD adult male (black, n = 3), DMD adult female (blue, n = 4), DMD 13-year-old (13y) male (purple, n = 4), DMD 7-year-old (7y) male vs. healthy male (brown, n = 3) and healthy female (orange, n = 3). The PCA plot was created using Metaboanalyst. Analysis was applied on the log-transformed intensities, normalized by the median with auto-scaling. The colored ellipses represent 95CI areas. Group separation as captured by the first principal component distinguished more severe DMD phenotypes from the less severe and healthy ones. (B) Unsupervised clustering analysis presented by heatmap. Three of the four DMD CMs were clustered together apart from the healthy control, while the arrhythmia-free 7y CMs were clustered with the healthy control. The heatmap was created in Metaboanalyst, using the same chromatographic feature intensities as in panel (A) (Ward clustering, Euclidean distance). (C) Venn diagrams showing that the intersections of metabolites either increased (left) or decreased (right) in the comparisons indicated in the labels (DMD adult male vs. healthy male, DMD 13y male vs. healthy male, DMD 7y male vs. healthy male and DMD adult female vs. healthy female). The metabolites present in most relevant intersections are listed below in the colored boxes. (D,E) Linoleic acid (left) as a representative of fatty acid accumulation in all DMD samples coupled with a decrease in acetyl carnitine (right). (F,G) An increase in adenosine coupled with a decrease in phosphocreatine in three out of four DMD samples as an indication of energy crisis. The Shapiro–Wilk test of normality was applied for all metabolite features to assess whether the data were normally distributed. Data were normalized to the median of the ratios. One-way ANOVA for male original samples followed by post hoc Tukey’s test, two-sided t-test for female original samples. * p < 0.05, ** p < 0.01, *** p < 0.001, **** p < 0.0001.

