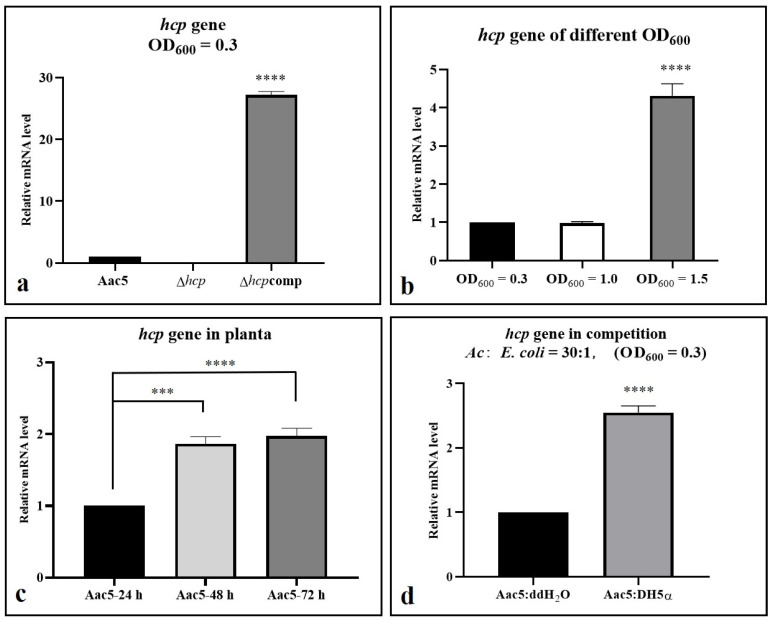
Figure 7.
Activation of Acidovorax citrulli hcp as determined by hcp relative expression level. qRT-PCR assays were performed to determine the relative hcp mRNA levels under different growth conditions. (a) Relative expression of hcp in Aac5, Δhcp, and Δhcpcomp under inactivated conditions (OD600 = 0.3). (b) Relative expression of hcp in WT strain Aac5 at different cell concentrations (OD600 = 0.3, 1.0, and 1.5). (c) Relative expression of hcp in Aac5 at 24, 48, and 72 h post inoculation (hpi) of watermelon cotyledons (104 CFU·mL−1). (d) Relative expression of hcp in Aac5 and Δhcpcomp cells co-cultured with E. coli DH5α at a ratio of 30:1 for 3 h. The relative expression levels of hcp were calculated using the 2−ΔΔCT method. The data were analyzed by independent sample t test. “***” means p value < 0.001 and “****” means p value < 0.0001.

