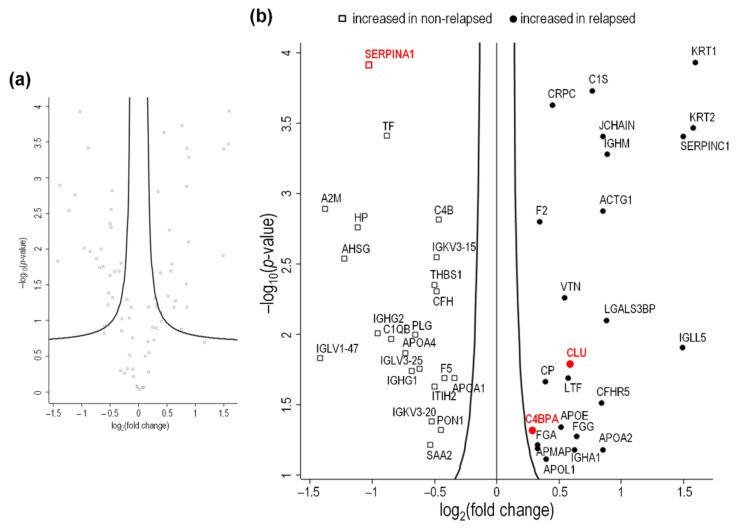
Figure 2.
Volcano plot showing proteomic data by HL status (relapsing vs. non-relapsing) in the exploratory cohort. Log2 transformed abundance ratios for each protein are plotted on the x-axis. Negative log10 transformed p-values are plotted on the y-axis. The 107 proteins identified and quantified are shown in grey in (a). Among them, there were 24 proteins (circles) significantly more abundant, and 22 (squares) less abundant in patients whose HL relapsed than in non-relapsing patients (b). Proteins selected in Part II are evidenced in red.

