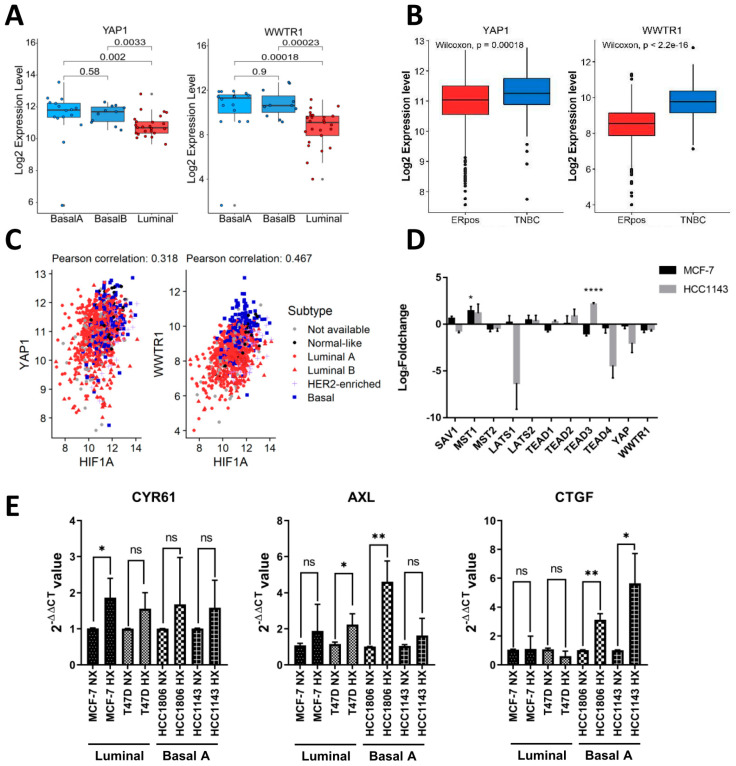
Figure 2.
Expression of YAP and TAZ in breast cancer cell lines and tumors. (A) RNA expression level of YAP and TAZ (WWTR1) from RNA-Seq data for 52 human breast cancer cell lines classified by luminal−, basal A−, or basal B−like subtype [33]. p-value calculated using One−way ANOVA. (B) Log2RNA expression levels of YAP and TAZ in ER positive and TNBC clinical samples. p-value calculated using Wilcoxon signed-rank test. (C) Correlation between RNA expression levels for HIF1α and YAP and for HIFα and TAZ determined using cBioPortal data from basal-like, HER2 enriched, luminal A and luminal B breast cancer subtypes. (D) Expression of YAP, TAZ, TEAD1−4, and upstream kinases in the Hippo signaling cascade determined in TempO-Seq data. Log2foldchange under hypoxia relative to normoxia is shown in MCF7 and HCC1143. Mean and SD of triplicate measurements is shown. *, padj < 0.05; ****, padj < 0.0001. (E) qPCR experiment showing expression of the indicated YAP/TAZ targets genes in the indicated luminal and basal A TNBC cell lines exposed to normoxia or hypoxia after 5 days. Mean expression relative to β−actin is shown. Error bars indicate SD for triplicate measurements. *, p < 0.05; **, p < 0.01; ns, not significant.

