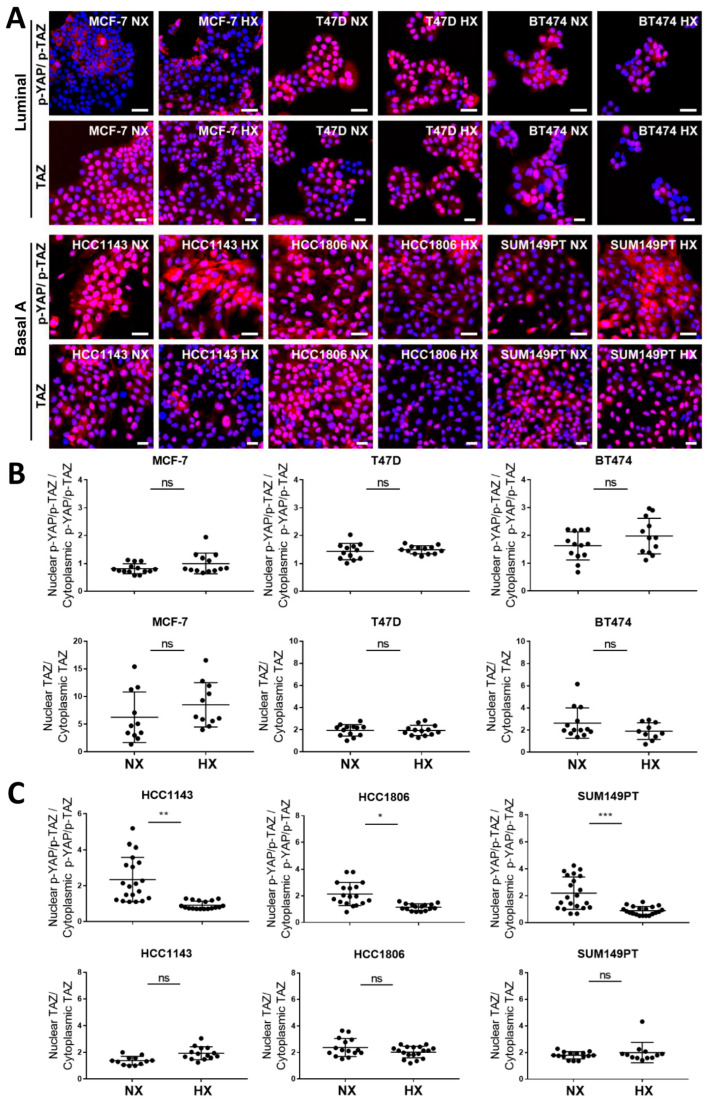
Figure 6.
Localization of TAZ and phosphorylated YAP/TAZ in luminal breast cancer and basal A cells under normoxia and hypoxia. (A) Localization of TAZ and p-YAP/TAZ (using an Ab detecting both p-YAP(Ser127) and p-TAZ (Ser89)) determined by confocal immune fluorescence microscopy in luminal (MCF7, T47D and BT474) and basal A (SUM149PT, HCC1806 and HCC1143) breast cancer cell lines cultured under normoxia (NX) or hypoxia (HX) for 5 days. Blue, Hoechst; Red, Abs. (B,C) Quantification of nuclear/cytoplasmic distribution of TAZ and p-YAP/TAZ in luminal (B) and basal A cells (C) cultured under normoxia or hypoxia, calculated form images in (A). Y-axis indicates percentage of the total intensity in the nuclei area versus percentage of the total intensity in the cytoplasm area. *, p < 0.05; **, p < 0.01; ***, p < 0.001; ns, not significant.

