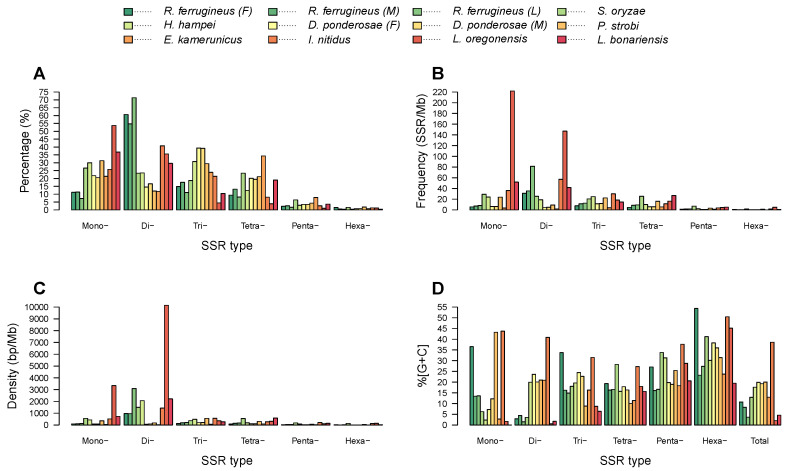
Figure 3.
Comparison of SSR types according to their percentage, frequency, density, and GC content in the weevil genome assemblies. Percentages were determined by dividing the number of SSRs of a given type by the total number for that species. (A–D) represent the percentage, frequency, density, and GC content of SSRs, respectively.

