Figure 1.
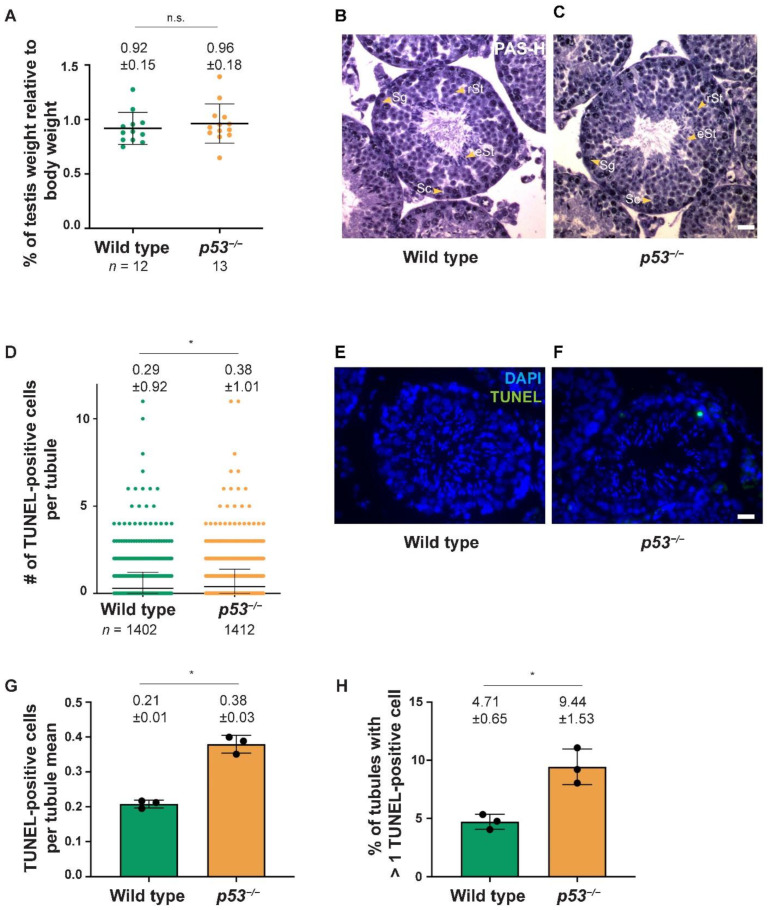
The absence of p53 does not grossly alter spermatogenesis. (A) Graph showing normalized testes weight (testes weight divided by body weight) of wild type and p53−/− testes. Horizontal lines represent means ± SD. Means (±SD) are indicated above the graph; (B,C) Representative tubule sections from adult testes of the indicated genotypes stained with PAS-hematoxylin. Wild-type and p53−/− seminiferous tubules contain spermatogonia (Sg), spermatocytes (Sc), round spermatids (rSt), and elongated spermatids (eSt). The scale bar in (C) represents 20 µm and applies to all panels; (D) Quantification of the number of TUNEL-positive cells per tubule of the indicated genotypes. Horizontal lines represent the mean ± SD, which is indicated over the graph (mean ± SD), and (n) shows the number of tubules counted per genotype; (E,F) Representative tubules are shown from testis sections of a wild-type and p53−/− testis stained with TUNEL to detect apoptotic spermatocytes (green) and DAPI (blue). Scale bars in (C,F) represent 20 µm and apply to all panels; (G) Bar graph shows average TUNEL-positive cells for wild-type (N = 3) and p53−/− testes (N = 3). Bars represent mean ± SD; (H) Bar graph represents percentage of tubules with more than one TUNEL-positive cell, for wild-type (N = 3) and p53−/− testes (N = 3). In panels (A,D,G,H), the results of t-tests are indicated as (n.s.) not significant and (*) p < 0.01; Bars represent mean ± SD.

