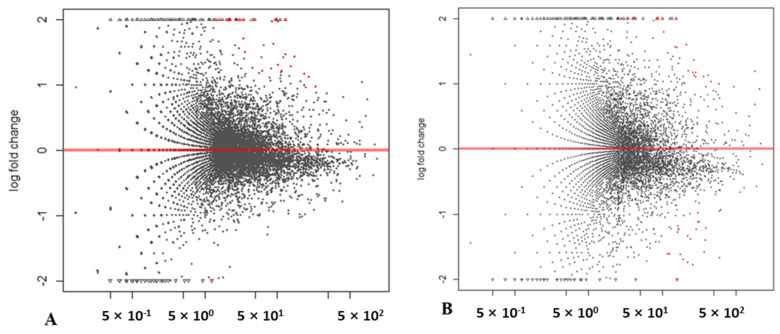
Figure 2.
MA-plot from base means (x-axis; ‘M’) and the average of log fold changes (y-axis; ‘A’), indicating differentially expressed genes in pea resistant (R) or susceptible (S) to Aphanomyces root rot in DESeq analyses of (A) an in silico mix with three replicates in resistant (R) and susceptible (S) bulks, and (B) an in silico mix with two replicates in R and S bulks. Red spots indicate genes with Padj < 0.05.

