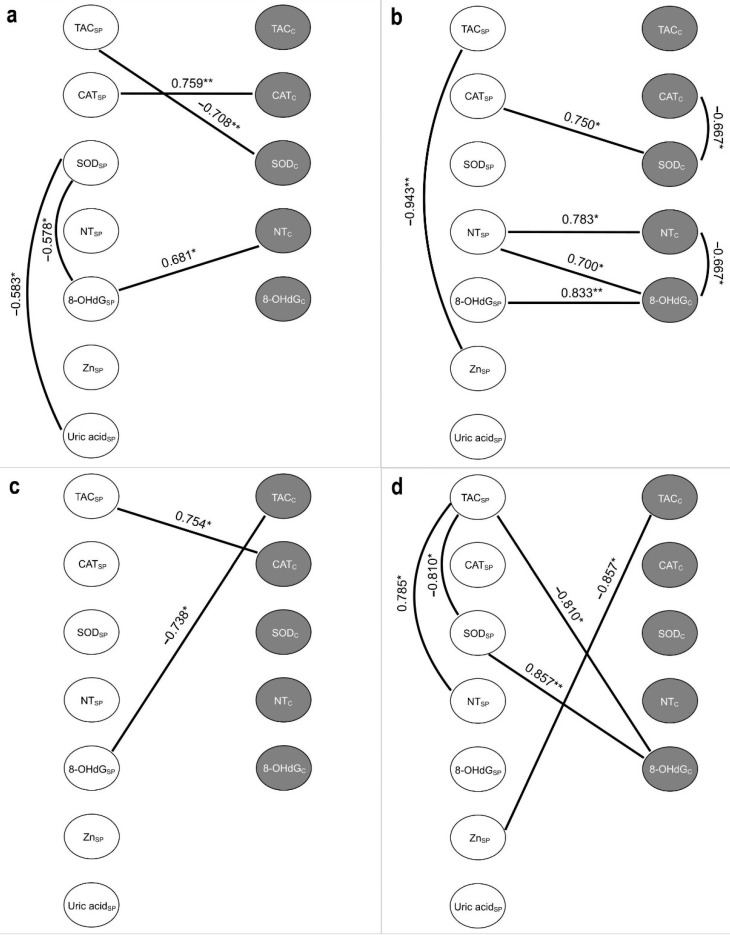
Figure 5.
Correlation pleiades of the studied markers in groups (a) COVID−, TUNEL<15; (b) COVID+, TUNEL<15; (c) COVID−, TUNEL>15; (d) COVID+, TUNEL>15. 8-OHdG—8-hydroxy-2′-deoxyguanosine; CAT—catalase; NT—nitrotyrosine; SOD—superoxide dismutase; TAC—total antioxidant capacity; C (subscript)—cellular; SP (subscript)—in seminal plasma. The Spearman correlation coefficient was used to identify the strength and direction of the relationship between studied markers. *—p ≤ 0.05; **—p ≤ 0.01.

