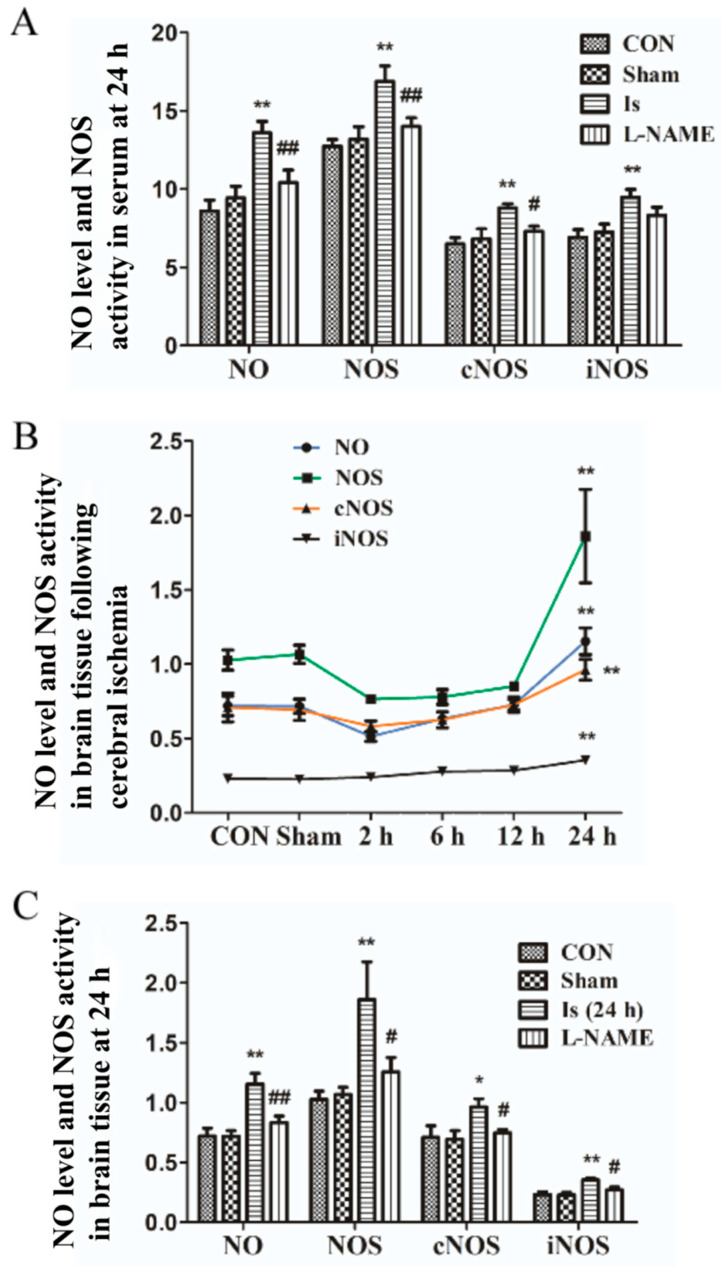
Figure 3.
Expression of NO/NOS in serum and brain tissue. (A) The content of NO and NOS/cNOS/iNOS in serum at 24 h after ischemic induction in each group. (B) The content of NO and NOS/cNOS/iNOS in brain tissue at 2 h, 6 h, 12 h and 24 h after ischemic induction. (C) The effects of L-NAME on the highest expression of NO and NOS/cNOS/iNOS (at 24 h after ischemic induction) in brain tissue. Data are presented as mean ± SEM (n = 6 per group). * or ** indicates that the difference between the Is and the CON is significant (p < 0.05) or extremely significant (p < 0.01); # or ## indicates that the difference between the L-NAME and the Is is significant (p < 0.05) or extremely significant (p < 0.01).

