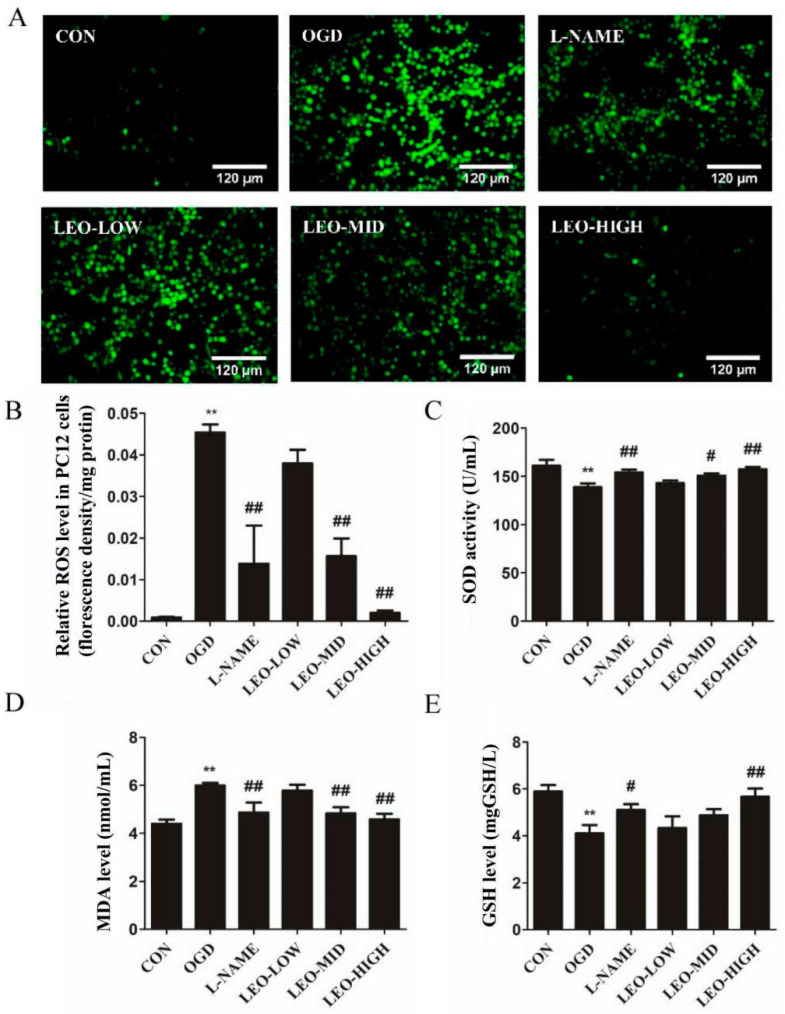
Figure 6.
Effects of leonurine on oxidative stress factors in OGD-induced PC12 cells. The fluorescence value of ROS (A,B) and the contents of SOD (C), MDA (D) and GSH (E) in each group after OGD for 2 h. Data are presented as mean ± SEM. ** indicates that the difference between the OGD and the CON is extremely significant (p < 0.01); # or ## indicates significant (p < 0.05) or extremely significant (p < 0.01) difference compared with the OGD. CON: control group; OGD: OGD model group; L-NAME: the L-NAME group (1 mmol/L); LEO-LOW: low dose of leonurine (50 μg/mL); LEO-MID: middle dose of leonurine (100 μg/mL); and LEO-HIGH: high dose of leonurine (200 μg/mL). The same below in vitro.

