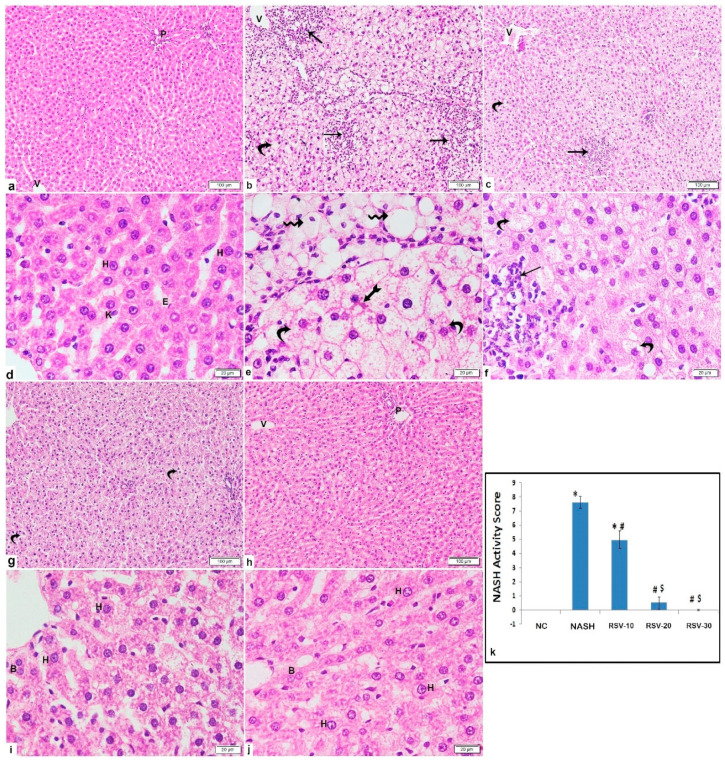
Figure 2.
Photomicrographs of H&E-stained liver sections show: Photomicrographs of H&E-stained liver sections show: (a,d) NC: normal architecture displays portal tract (P), central vein (V) and radiating cords of hepatocytes separated by blood sinusoids. The hepatocytes illustrate acidophilic cytoplasm and vesicular nuclei with prominent nucleoli (H). The blood sinusoids are lined with endothelium (E) and Kupffer cells (K). (b,e) NASH: obvious damage of liver tissue with large areas of inflammatory cells infiltration (arrow), involving all zones; peri-central (zone3), mid-lobular (zone2) and peri-portal (zone1), widespread ballooning of hepatocytes illustrating micro-vesicular vacuolations (curved arrow) and dilated central veins (V). Some cells show one large-sized cytoplasmic vacuole (wavy arrow) with eccentric or peripheral flattened nuclei others display acidophilic cytoplasmic Mallory-Denk body (bifid arrow). (c,f) RSV-10: focal area of inflammatory cells infiltration (arrow) among the hepatocytes in zone2, micro-vesicular cytoplasmic vacuolation of hepatocytes (curved arrow) and dilated central vein (V). (g,i) RSV-20: preserved architecture with some hepatocytes displaying variable cytoplasmic vacuolation. The hepatocytes display acidophilic cytoplasm and either vesicular nuclei and prominent nucleoli (H), dark nucleus (arrowhead) or binucleation (B). (h,j) RSV-30: preserved architecture with central vein (V), portal tract (P) and most of hepatocytes illustrate acidophilic cytoplasm. (Inset): hepatocytes with vesicular nuclei and prominent nuclei (H) and binucleation (B). (k) The mean of NASH liver scoring (±SD) in the control and the experimental groups: * p < 0.05 compared to the NC; # p < 0.05 compared to NASH; $ p < 0.05 compared to RSV-10. [Magnification: 100×; 400×].

