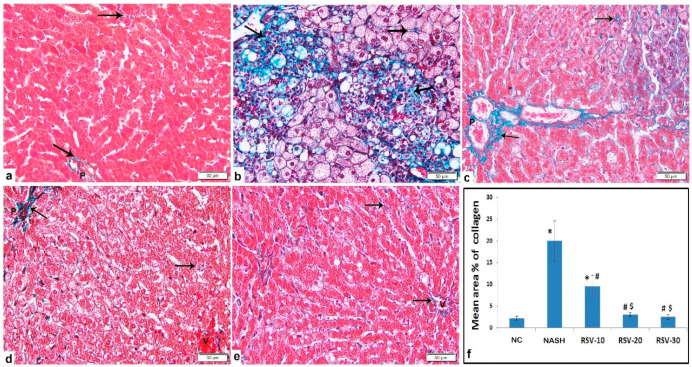
Figure 3.
Photomicrographs of Masson trichrome-stained liver sections show: (a) Control: fine collagen fibers among hepatocytes and around the portal tract. (b) NASH: marked collagen deposition in multiple large areas in association with inflammatory cells infiltration and macro-vesicular steatosis, in addition to pericellular/perisinusoidal fibrosis. (c) RSV-10: increased peri-portal collagen deposition and among hepatocytes. (d,e) RSV-20 and RSV-30: fine collagen fibers. [Arrow: collagen deposition; P: portal tract; V: central vein]. [Magnification: 200×]. (f) The mean area % of collagen deposition (±SD) in the NC and the experimental groups: * p < 0.05 compared to the control group; # p < 0.05 compared to NASH; $ p < 0.05 compared to RSV-10.

