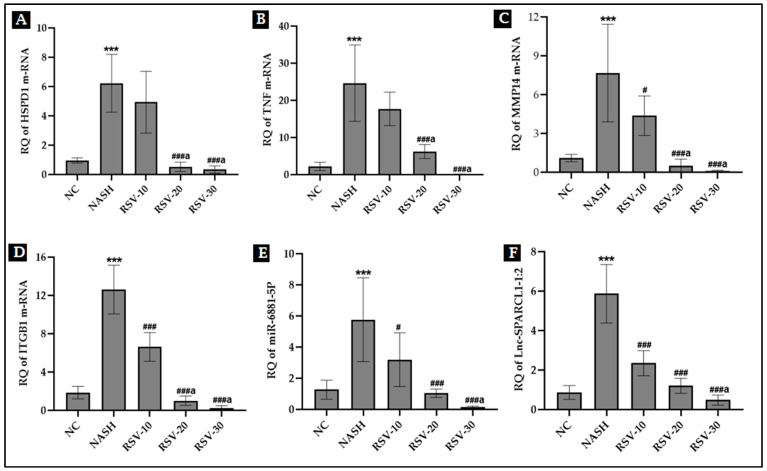
Figure 4.
Effect of rosavin treatment on the expression level of hepatic m-RNAs: HSPD1, TNF, MMP14, and ITGB1 (A–D); (E): hepatic miRNA-6881-5P and (F): hepatic LncRNA SPARCL1-1:2. Values are mean ± SD; number of animals = 8 rats/each group. *** p < 0.001 vs. NC group; ### p < 0.001, and # p < 0.05 vs. NASH group. a p < 0.05 compared to RSV-10. One-way ANOVA followed by Tukey’s multiple comparison test RQ, relative quantification.

