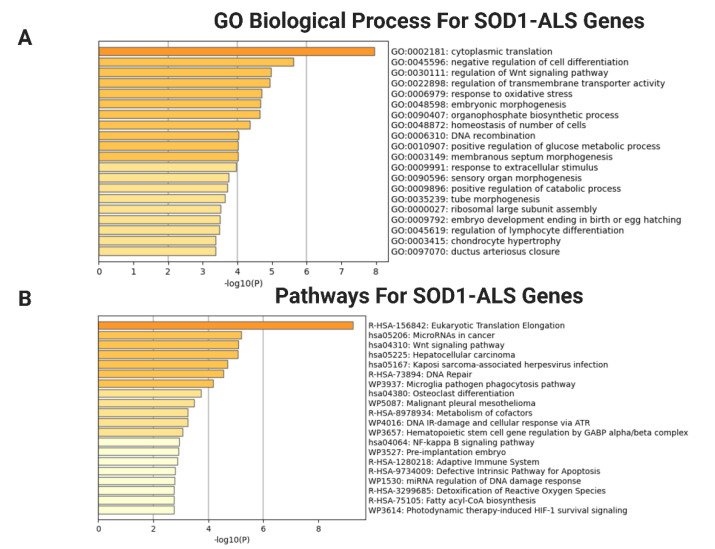
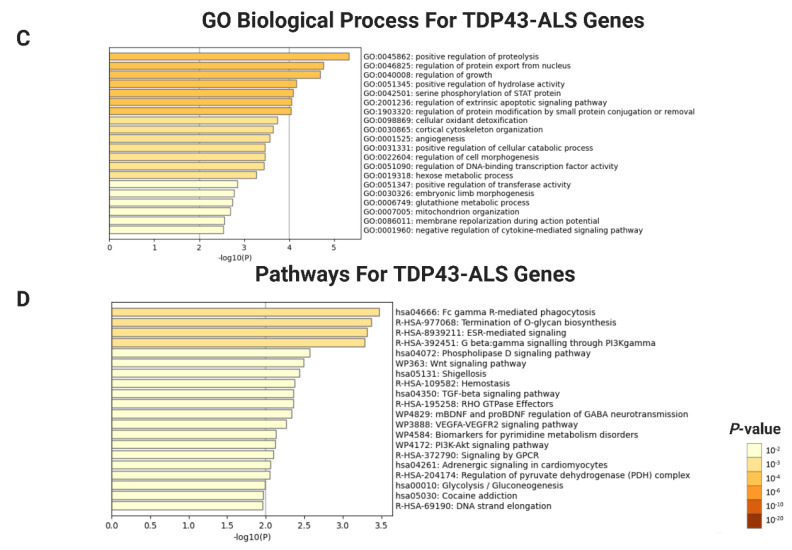
Figure 2.
Functional enrichment analysis of DEGs by Metascape (https://metascape.org/gp/index.html#/main/step1, accessed on 6 July 2022) revealed distinct pathways in SOD1- and TDP43-ALS. (A) Metascape bar chart of enriched GO and (B) Pathway terms (KEGG/Reactome/WikiPathway) across the input DEGs in SOD1-ALS. (C) Metascape bar graph of GO terms and (D) KEGG pathways that are significantly enriched in DEGs specific for TDP43-ALS datasets. X-axis represents the statistical significance of the enrichment (−log10 (p-value)). Bar chart of GO and Pathway terms colored by p-values ≤ 0.05 were adapted from Metascape, where terms containing more genes tend to have more significant p-values. The length of the bar represents the significance of that specific gene-set or term. The brighter the color, the more significant that term is.


