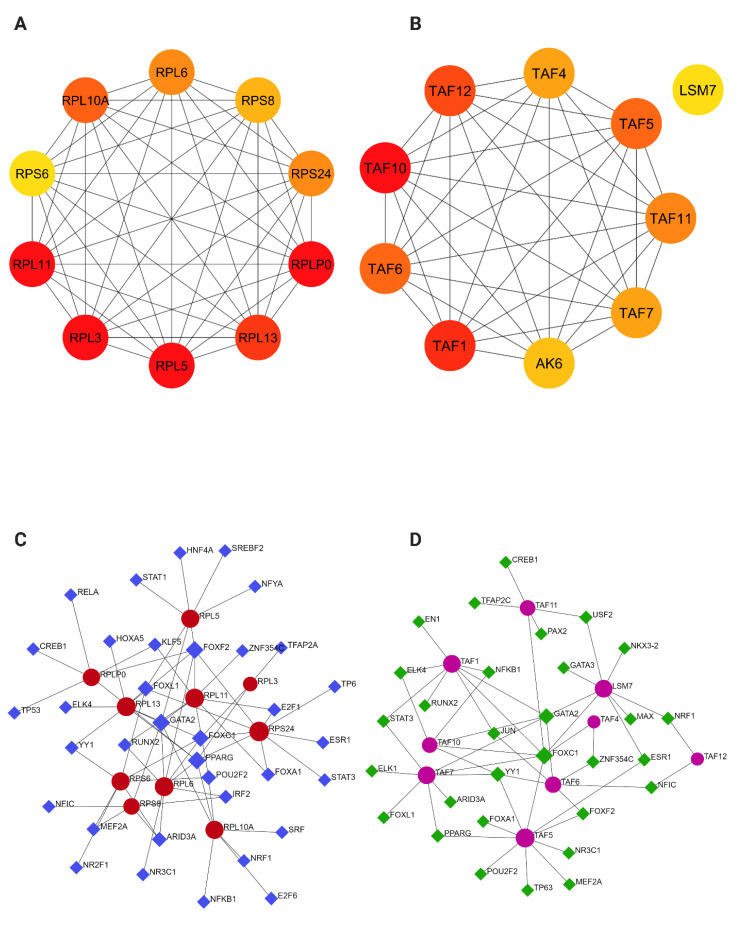
Figure 4.
Integrated analysis on hub genes further highlighted one main pathway in SOD1- and TDP43 ALS. (A) Top 10 hub genes from SOD1- and (B) TDP43-ALS identified using the cytoHubba plugin (Cytoscape) among TDP43-ALS and SOD1-ALS datasets. The deeper the color of the node, the higher the level of significance at the PPI network. (C) The hub gene-transcription factor (TF) regulatory interaction networks in SOD1- and (D) TDP43-ALS datasets. Red and pink nodes stand for the hub gene and blue and green diamond stands for the transcription factor.

