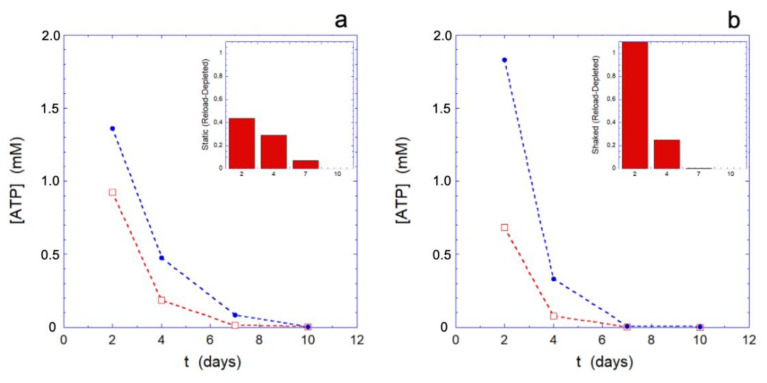
Figure 3.
Results of the rejuvenation procedure on static (panel (a)) and mechanically stimulated (panel (b)) samples. The red squares represent the intracellular ATP content prior to the rejuvenation procedure, while the blue dots represent the intracellular ATP content immediately after the procedure. Insets are shown inside the graphs, to better highlight the ATP increment during the reload. The ATP concentrations are shown in log scale.

