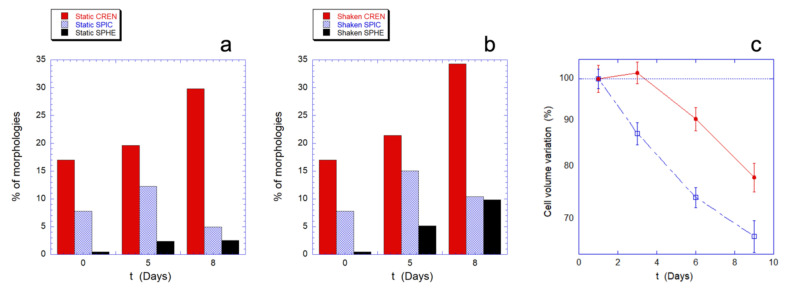
Figure 5.
Morphological evolution and volume variation as a function of the RBC aging. Panels (a,b) show the morphological evolution in absence (a) or presence (b) of mechanical stimulation. The red, light blue, and black columns represent the percentage of altered, non-biconcave, shapes observed in the samples. The data arise from a count of at least 1000 cells per sample performed with a conventional optical microscope. Therefore, these analyses do not have enough sensitivity on the nanoscale to appreciate the details of the cell membrane but these data allow the analysis of a statistically significant dataset composed of a high number of cells. Panel (c) shows the decreasing trend of the mean cell volume, as measured using AFM imaging, for static controls (red circle) and mechanically stimulated cells (open square) as function of the aging. It is worth noting that, for experimental reasons, the optical and the AFM images were collected on alternating days, in such a way that the comparison between these techniques must be performed in term of the overall observed trends.

