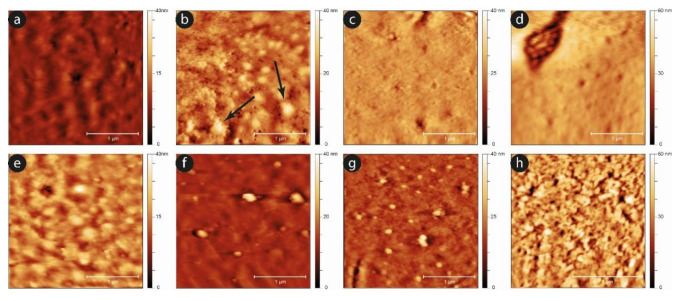
Figure 8.
Typical high resolution images of the plasma membrane for static controls (upper panels) and mechanically stimulated samples (lower panels) after one (a,e), three (b,f), six (c,g), and nine days (d,h) of aging. The data suggest that the occurrence of features such as micro-vesicles and other membrane markers of aging arises sooner in the mechanically-stimulated samples.

