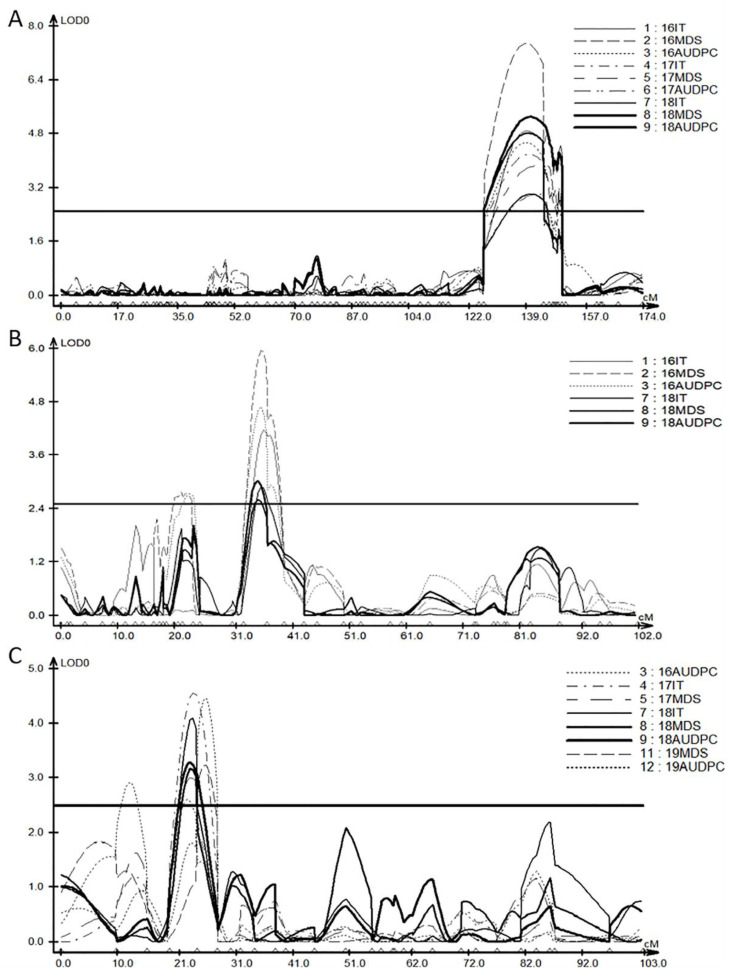
Figure 3.
Composite interval mapping (CIM) of QTLs for stripe rust adult-plant resistance on chromosomes 1B (A), 5B (B), and 6B (C), using phenotypic data collected from the four experiments from 2016 to 2019. The line parallel to the X-axis is the threshold line for the significant LOD score of 2.5. Genetic distances are shown in centiMorgans (cM). IT = infection type; MDS = maximum disease severity; AUDPC = area under the disease progress curve.

