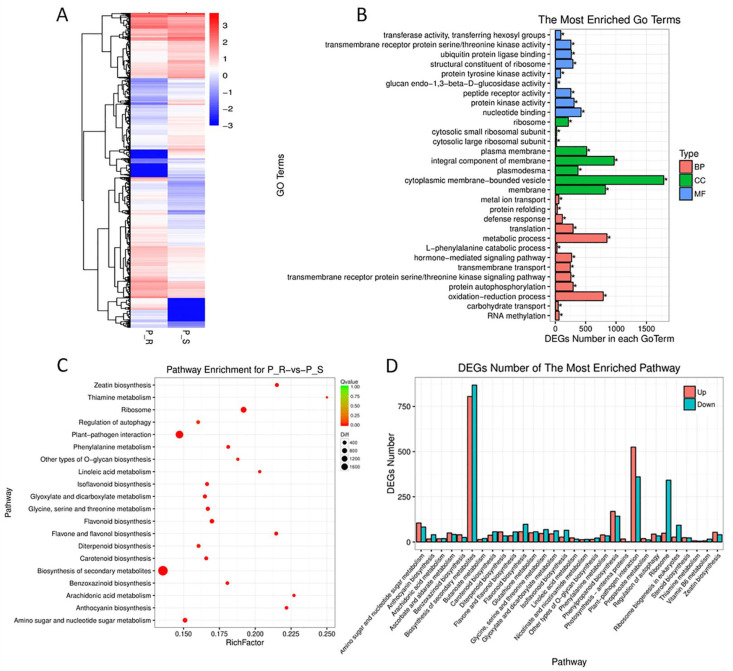
Figure 5.
Gene ontology (GO) analysis of the differentially expressed genes (DEGs) between Tutoumai (TTM) and Siyang 936 (SY936). (A) Cluster heat map of DEGs between the resistant parent TTM (P_R) and susceptible parent SY936 (R_S). (B) The most enriched GO terms of the DEGs. (C) Pathway enrichment of the DEGs. (D) Number of DEGs of the most enriched pathway.

