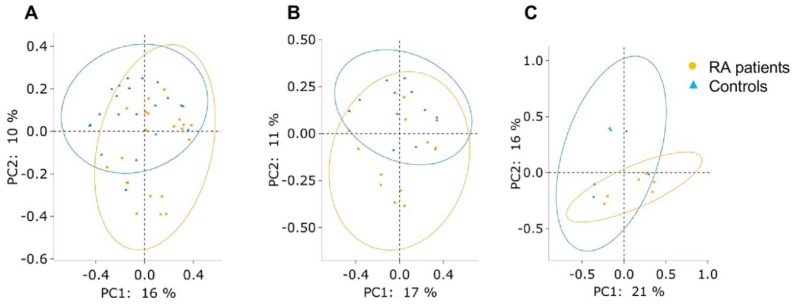
Figure 3.
The subgingival microbiota clustering by PCoA based on Bray–Curtis dissimilarity between the RA patients (orange dots) and controls (blue triangles). (A) Group AM (ANOSIM: R = 0.177, p = 0.001 and PERMANOVA: pseudo-F = 2.561, p = 0.001), (B) group PD (ANOSIM: R = 0.15, p = 0.013 and PERMANOVA: pseudo-F = 1.722, p = 0.018), and (C) group PH (ANOSIM: R = 0.167, p = 0.116 and PERMANOVA: pseudo-F = 1.449, p = 0.076).

