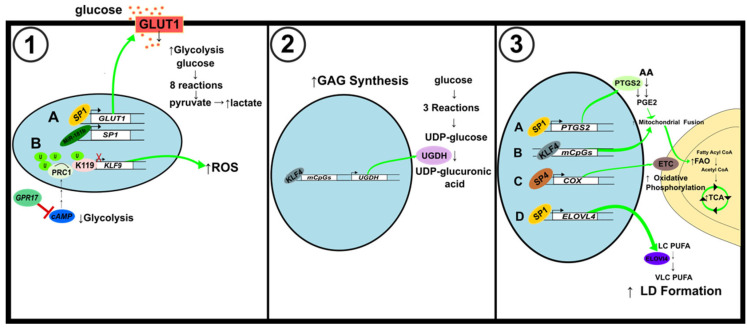
Figure 7.
Schematic illustration of metabolic alterations in brain and nerve cancer. (1) Alterations to glycolytic pathway. (A) SP1 activation by miR-181b results in an increase in GLUT1 levels and ultimately glycolysis levels. (B) GPR17 inhibits cAMP to decrease PRC1-mediated histone H2A K119 monoubiquitination of the KLF9 promoter. Activation of KLF9 increases ROS but reduces cell proliferation. (2) Alterations of glycosaminoglycans synthesis. KLF4 binding to mCpGs increases the expression of UGDH, a key regulator of GAG synthesis. (3) Modifications to mitochondrial fusion and fission, and lipid metabolism. (A) SP1 activates PTGS2 to induce mitochondrial fusion and increase ATP production through FAO and the TCA cycle. (B) KLF4 binding to mCpGs also induces mitochondrial fusion. (C) SP4 activates the expression of COX, also known as Complex IV of the ETC, to increase mitochondrial oxidative phosphorylation. (D) SP1 binds to the ELOVL4 promoter to augment LD formation.

