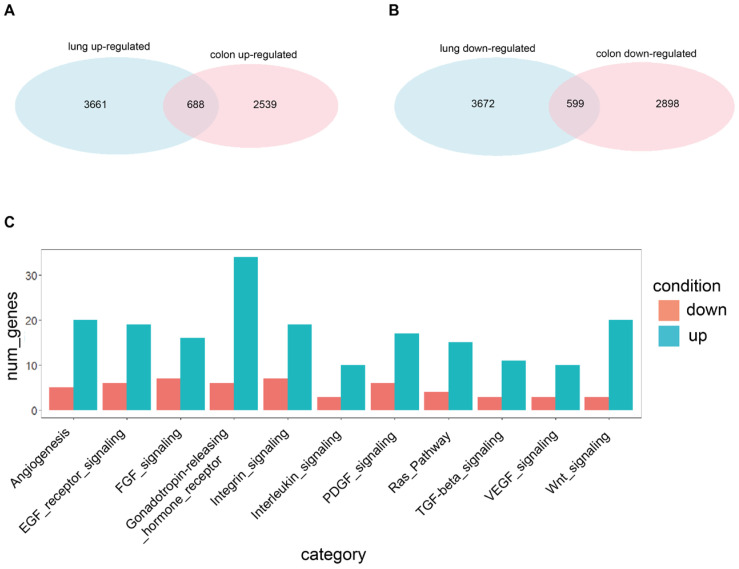
Figure 3.
Shared genes resulting from differential expression analysis performed with the standard limma. (A) Venn diagram reporting the number of significantly up-regulated genes in the PKH26+ state identified by the limma approach in the lung (3661 genes) and colon (2539 genes) systems, and in both systems (688 genes). Statistical significance of the overlap: p-value < 1 × 10⁻⁴; RR = 7.2. Genes are considered significant if they appear in the first 6000 of the ranking built on the logFC, with a nominal p-value < 0.05. Duplicated genes are removed. (B) Venn diagram reporting the number of significantly down-regulated genes in the PKH26+ state identified by the limma approach in the lung (3672 genes) and colon (2898 genes) systems and in both systems (599 genes). Statistical significance of the overlap: p-value < 1 × 10⁻⁴; RR = 5.9. Genes are considered significant if they appear in the last 6000 of the ranking built on the logFC, with a nominal p-value < 0.05. Duplicated genes are removed. (C) Barplot reporting the number of significantly up- and down-regulated genes in the PKH26+ state, identified by the limma approach and shared by the lung and colon systems, belonging to some interesting KEGG categories (reported on the x-axis) found using Panther. Abbreviations: num_genes = number of genes; down = down-regulated; up = up-regulated.

