Figure 6.
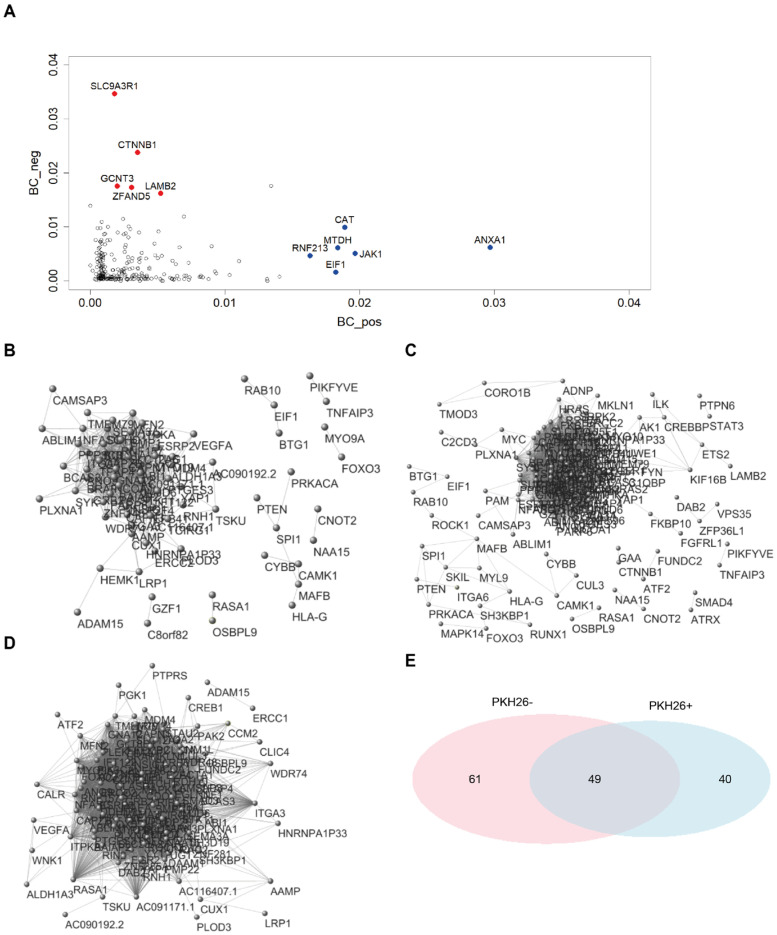
Network built on the PKH26+, PKH26− and all-samples datasets. (A) Betweenness centrality scores in both PKH26+ (x-axis) and PKH26− (y-axis) networks. “High traffic” genes behaving differently between PKH26+ and PKH26− are highlighted in red. (B) Network visualization from the PKH26+ dataset. Network was built considering as connected only pairs of nodes with extremely elevated correlations (r > |0.98|). See Table S14 for more details. (C) Network visualization from the PKH26− dataset. Network was built considering as connected only pairs of nodes with extremely elevated correlations (r > |0.98|). See Table S15 for more details. (D) Network visualization from the all-samples dataset. Network was built considering as connected only pairs of nodes with extremely elevated correlations (r > |0.98|). See Table S16 for more details. (E) Venn diagram reporting the number of genes identified in the PKH26+ (40 genes) and in the PKH26− network (61 genes), and in both PKH26+ and PKH26− networks (49 genes). Networks were built considering as connected only pairs of nodes with extremely elevated correlations (r > |0.98|). Statistical significance of the overlap: p-value < 1 × 10⁻⁴; RR = 3.6.

