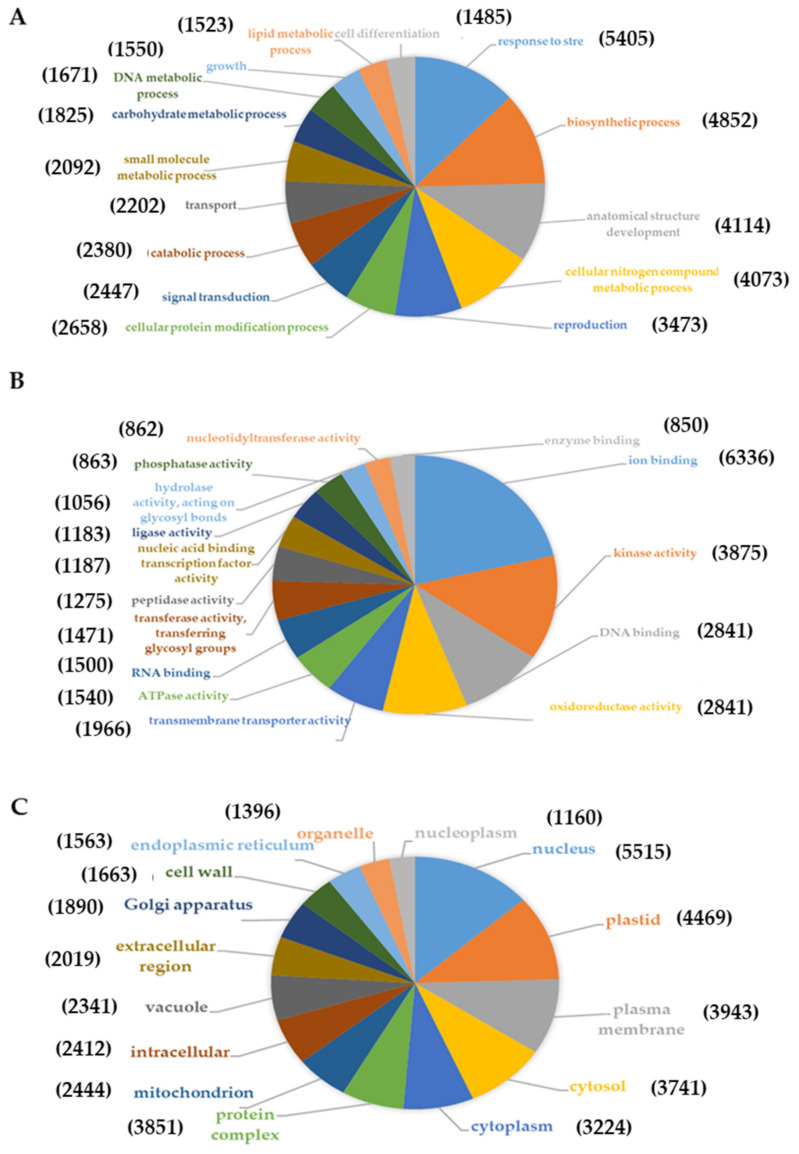
Figure 4.
Pie charts of GO classification of assembled Q. ilex transcripts including the first 15 transcripts assigned to biological processes (A), molecular functions (B) and cellular components (C). The number in parentheses indicates the number of transcripts. The remaining transcripts assigned to each GO category are shown in Guerrero-Sánchez et al. [104].

