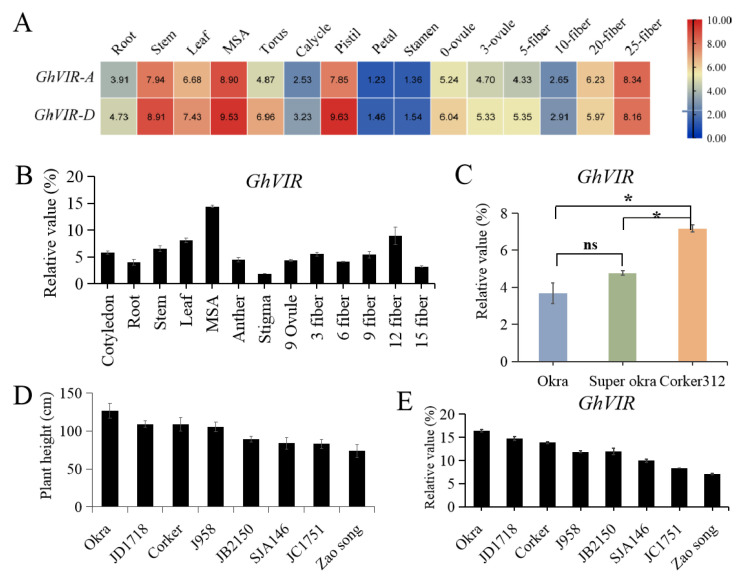
Figure 2.
Expression patterns of GhVIR-A/-D in upland cotton. (A) Heat map analysis of GhVIR-A/-D genes expressions in different organs of upland cotton. The color from blue to red indicates low to high expression. (B) Quantitative real-time PCR (qRT-PCR) analysis of GhVIRs in various tissues of upland cotton. Results were normalized against the expression level of GhUBI1. MSA, main stem apex; 9 Ovule, Ovule at 9-day post-anthesis; 3–15 fiber, 3–15 day post anthesis fiber. Error bars indicate SD. (C) Quantitative real-time PCR analysis of GhVIR in the third leaf of cotton species with different leaf shape. (D) Comparison of plant height of eight allotetraploid cotton cultivars (G. hirsutun). The heights of plants were calculated when cotton bolls were opening. (E) QRT-PCR analysis expression of GhVIR in main stem apex (MSA) of different cotton species. The X-axis represents different upland cotton species, while the Y-axis represents gene relative expressions. Results were normalized against the expression level of GhUBI1. Error bars indicate SD of three biological replicates (* p < 0.05), ns = no significance.

