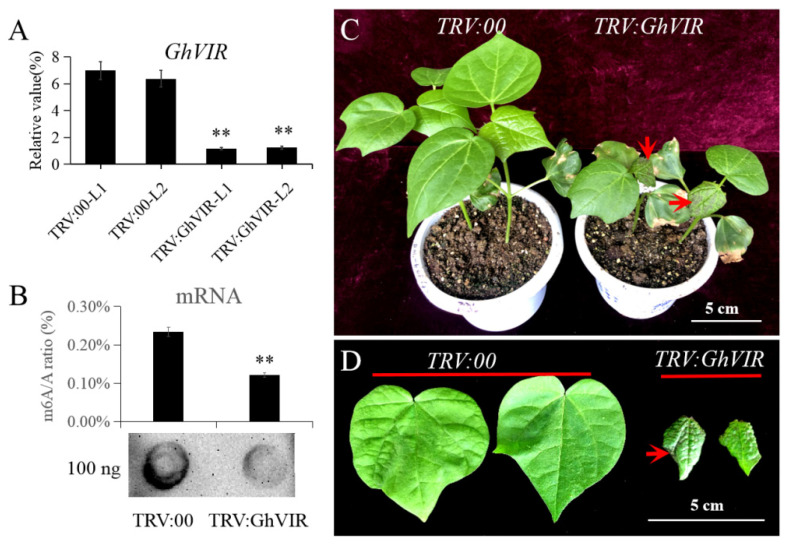
Figure 3.
Phenotypic analysis of TRV:GhVIR plants. (A) Expression analysis of the second leaf of 2-leaf stage TRV:GhVIR plants and TRV:00 plants. (B) mRNA m6A level analysis of the second leaf of 2-leaf stage TRV:GhVIR plants and TRV:00 plants. Up-penal: mRNA m6A/A ratio (%) of the second leaf of 2-leaf stage TRV:GhVIR plants and TRV:00 plants by m6A RNA methylation quantification kit. Down-penal: dot blot analysis mRNA m6A level of the second leaf of 2-leaf stage TRV:GhVIR plants and TRV:00 plants. Error bars indicate SD of three biological replicates (** p < 0.01) for (A,B). (C) Whole plant phenotype comparison of 3–4 leaf stage TRV:GhVIR plants with TRV:00 plants (negative control group). (D) Second leaf phenotype comparison of 3–4 leaf stage TRV:GhVIR plants with TRV:00 plants.

