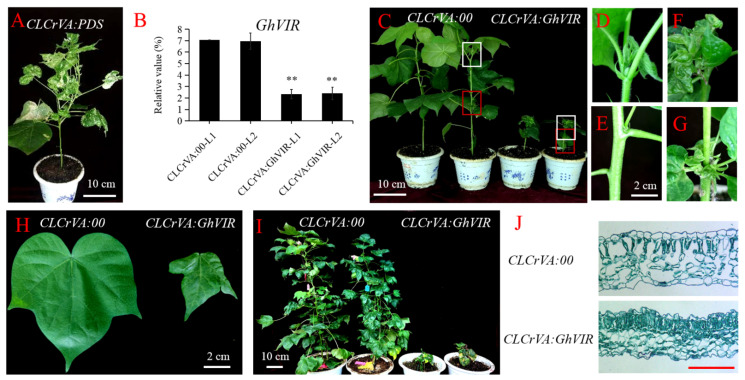
Figure 4.
Functional characterization of GhVIR using VIGS (CLCrVA system). (A) Phenotypes of silencing GhPDS (positive control). (B) Expression analysis of the second leaf of 3-leaf stage CLCrVA:GhVIR plants and CLCrVA:00 plants. Error bars indicate SD of three biological replicates (** p < 0.01). (C) Whole plant phenotype of 10 leaf stage CLCrVA:00 plants and CLCrVA:GhVIR plants. (D,E) Magnified views of boxes in CLCrVA:00 plants indicated in (C), respectively. (F,G) Magnified views of boxes in CLCrVA:GhVIR plants indicated in (C), respectively. (H) Third leaf phenotype comparison of 5-leaf stage CLCrVA:GhVIR plants with CLCrVA:00 plants. (I) Whole plant phenotype of blooming stage of CLCrVA:00 plants and CLCrVA:GhVIR plants. (J) Longitudinal sections of leaf blade of CLCrVA:00 plants and CLCrVA:GhVIR plants.

