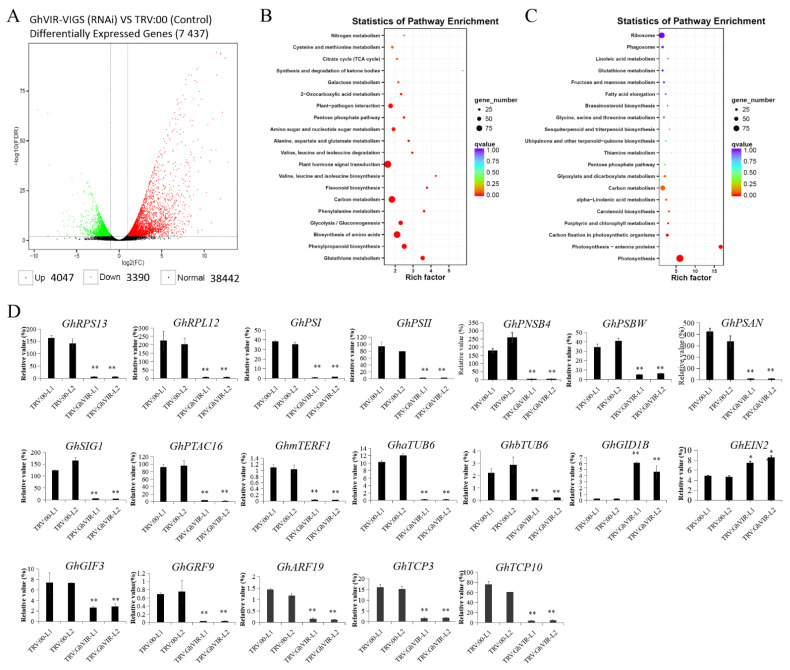
Figure 6.
RNA-Seq analysis of the differentially expressed genes (DEGs) in the second leaf of 2-leaf stage cotton of TRV:GhVIR plants. (A). Volcano of DEGs between TRV:00 and TRV:GhVIR plants. Red dots (upregulated) and green dots (down-regulated) indicate the up- and down-regulated genes in TRV:GhVIR leaves, respectively, compared with the TRV:00 leaves. (B). TRV:GhVIR vs. TRV:00 up. DEGs enriched KEGG pathway scatterplot. (C). TRV:GhVIR vs. TRV:00 down.DEGs enriched KEGG pathway scatterplot. (D). qRT-PCR analysis of genes related to leaf development in the second leaf of TRV:GhVIR plants. Total RNA was isolated from the second leaf of TRV:GhVIR plants and TRV:00 plants. GhUBI1 (EU604080) was used as internal reference. Error bars represent SD of three biological replicates. * p < 0.05; ** p < 0.01 by independent t-tests.

