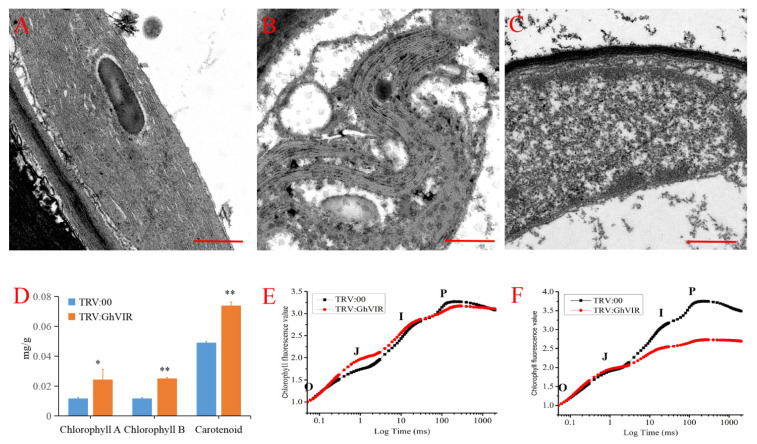
Figure 7.
Chloroplast ultrastructure, pigment content, and photosynthetic efficiency analysis in cotton leaves of TRV:00 plants and TRV:GhVIR plants. (A,C) Chloroplast ultrastructures of the TRV:00 plant (A), TRV:GhVIR-1 plant (B), and TRV:GhVIR-2 plant (C). Bar = 500 nm. (D) Photosynthetic pigment content in TRV:00 plant and TRV:GhVIR plants. (E,F) Detection of photosynthetic efficiency of cotton leaves in TRV:00 plant and TRV:GhVIR plants by OJIP transients. (E) Cotton leaves 10 d after injection of the Agrobacterium solution, and (F) cotton leaves 13 d after injection of the Agrobacterium solution. Error bars represent SD of three biological replicates. * p < 0.05; ** p < 0.01 by independent t-tests.

