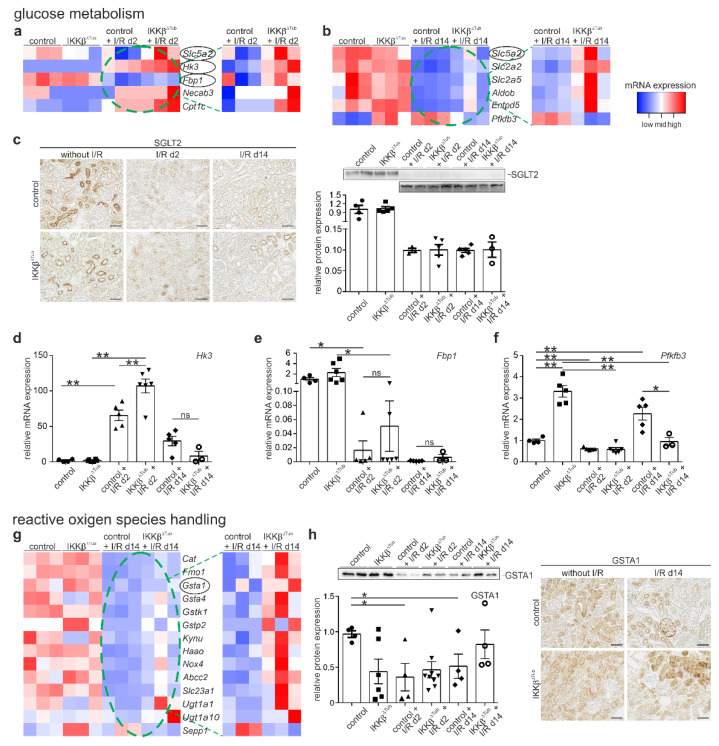
Figure 4.
Tubular deletion of IKKβ affects glucose metabolism and reactive oxygen species handling after I/R injury. (a,b) heatmaps of significantly altered mRNA of proteins known to affect glucose metabolism at 2 days (a) and at 14 days (b) after I/R injury compared to baseline. Filter criteria were DESeq p-values < 0.05; fold change > 1.5. mRNA further analyzed are encircled. All heatmaps (a,b,g) show samples organized in columns and genes in rows, expression intensities are color-coded. The green stippled circle indicates mRNA of I/R groups used for relative expression in heatmaps by comparing only control with IKKβ∆Tub at 2 days (a) and 14 days (b) after I/R injury. (c) Representative images of SGLT2 stained kidney sections and Western blot analysis from control and IKKβ∆Tub at baseline, 2 days and 14 days after I/R injury. Magnification scale bar = 50 µm. Densitometrical evaluation is presented in % arithmetic means ± SEM of n = 3–5 per group. (d,f) real-time PCR of Hk3 (d), Fbp1 (e) and Pfkfb3 (f) mRNA expression of kidneys from control and IKKβ∆Tub at baseline, 2 days and 14 days after I/R injury. Arithmetic means ± SEM of n = 3–6 per group. (g) heatmaps of significantly altered mRNA from proteins known to improve detoxification and reactive oxygen species handling at 14 days after I/R injury compared to baseline. Filter criteria were DESeq p-values < 0.05; fold change > 1.5. The green stippled circle indicates mRNA of I/R group used for relative expression in heatmaps by comparing only control with IKKβ∆Tub at 14 days after I/R injury; (h) representative images of GSTA1 stained kidney sections and Western blot analysis from control and IKKβ∆Tub at baseline, 2 days and 14 days after I/R injury. Magnification scale bar = 50 µm. Densitometrical evaluation is presented in % arithmetic means ± SEM of n = 4–9 per group. For (c–f,h) * p < 0.05, ** p < 0.01 using Mann–Whitney–U test (if n < 4 Lord test).

