Figure 3.
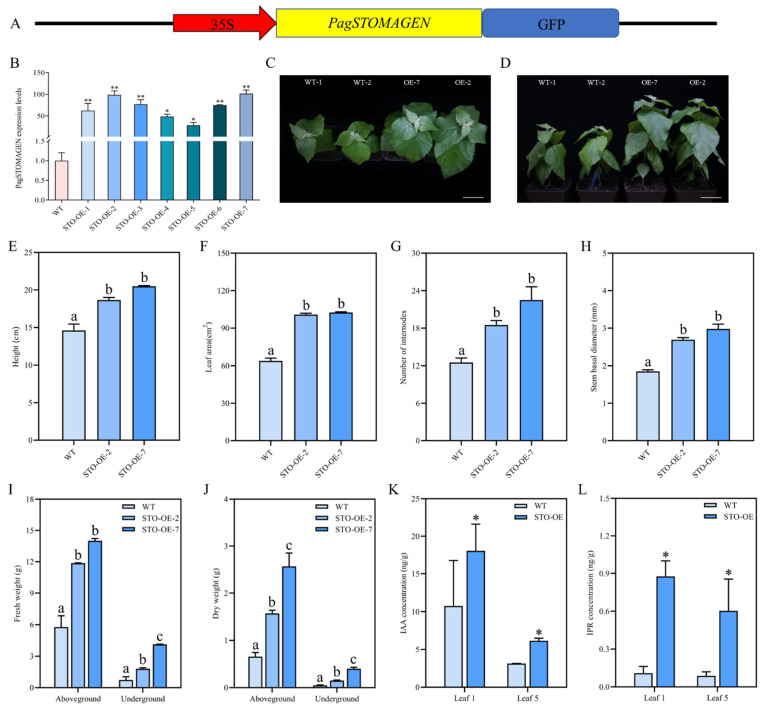
Generation and phenotypic changes in PagSTOMAGEN-overexpressing (STO-OE) lines. (A) Schematic diagram of the PagSTOMAGEN overexpression vector. (B) Expression levels of PagSTOMAGEN in the STO-OE lines. Values represent the mean ± SD (n = 5). (C,D) Two-month-old plants. WT: non-transgenic control; OE: PagSTOMAGEN-overexpressing lines. Bars = 5 cm. (E) Measurement of plant height. (F) Measurement of leaf area. (G) Measurement of the number of internodes. (H) Measurement of stem basal diameter. (I) Aboveground and underground fresh weight of STO-OE and WT lines. (J) Aboveground and underground dry weight of STO-OE and WT lines. (K) IAA concentration in different leaf positions of STO-OE and WT plants. (L) IPR concentration in different leaf positions of STO-OE and WT plants. Error bars represent the SD for each genotype with nine plants. Asterisks indicate significant differences in the Student’s t-test. ** p < 0.01; * p < 0.05. p < 0.05 was considered statistically significant and is represented by different letters.

