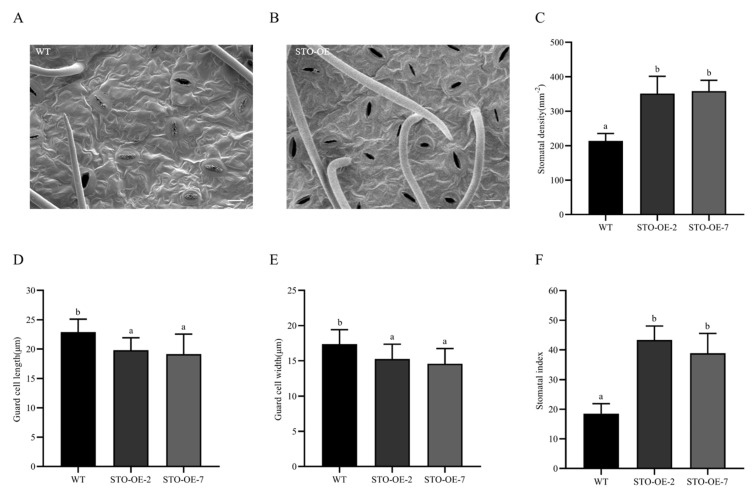
Figure 4.
Stomatal density, size, and stomatal index in STO-OE and WT poplar. (A) Abaxial leaf epidermis of WT lines. (B) Abaxial leaf epidermis of STO-OE lines. (C) Stomatal density of STO-OE and WT lines. (D) Guard cell length of STO-OE and WT lines. (E) Guard cell width of STO-OE and WT lines. (F) Stomatal index of STO-OE and WT lines. Error bars are indicated by the SD of five biological replicates. p < 0.05 was considered significantly different and is shown by different letters. Bars = 20 μm.

