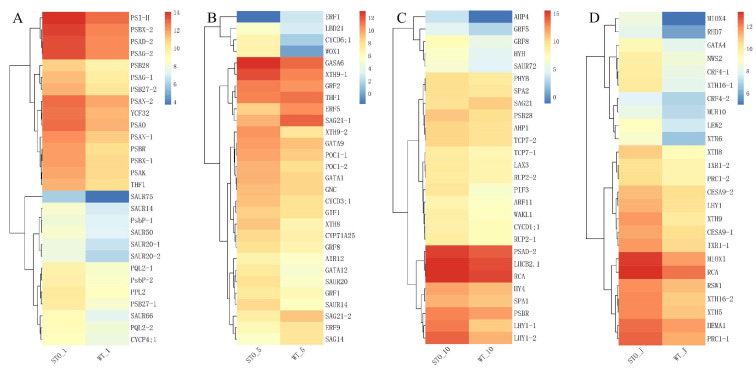
Figure 9.
The analysis of changes in DEGs involved in photosynthesis and growth. (A) Heatmap of DEGs of STO-OE and WT lines in 1st leaf position. (B) Heatmap of DEGs of STO-OE and WT lines in 5th leaf position. (C) Heatmap of DEGs of STO-OE and WT lines in 10th leaf position. (D) Heatmap of DEGs of STO-OE and WT lines in young stem. The color scale represents the FPKM value.

