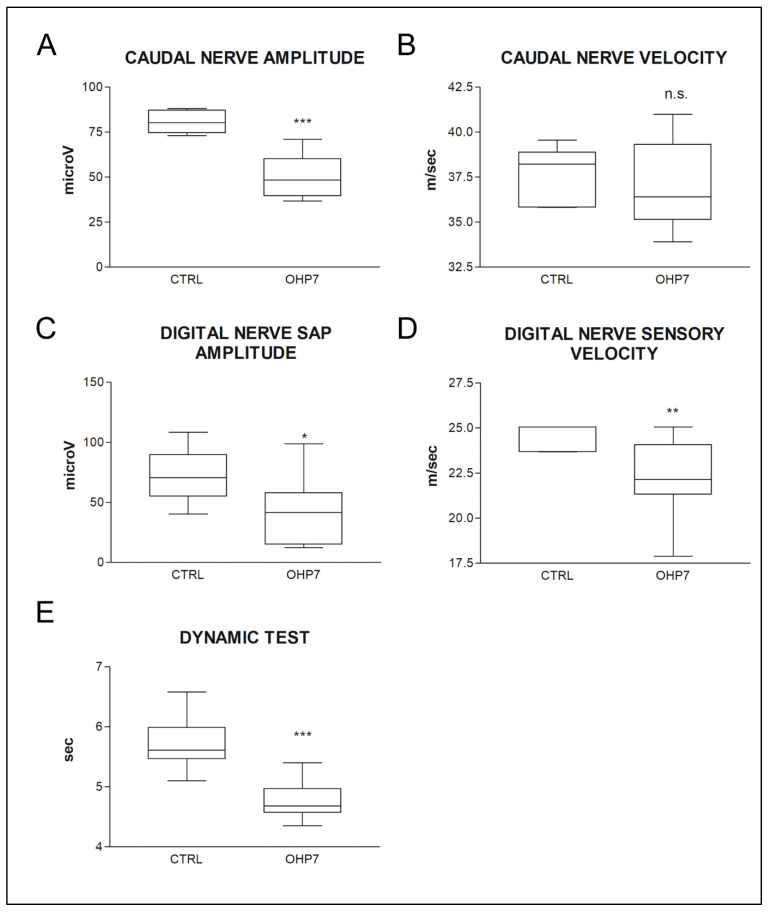
Figure 3.
In (A–D): nerve conduction study data at the end of treatment is shown. In (E) Dynamic (mechanical allodynia) test data at the end of treatment is shown. Statistical significance of Mann–Whitney U-test is shown in all graphs. The box-and-whiskers graphs show median and quartile values, as well as maximum and minimum values. * p-value < 0.05 vs. CTRL, ** p-value < 0.01 vs. CTRL, *** p-value < 0.001 vs. CTRL. CTRL: control group; OHP7: OHP-treated group. SAP: sensory action potential. n.s. means no significance.

