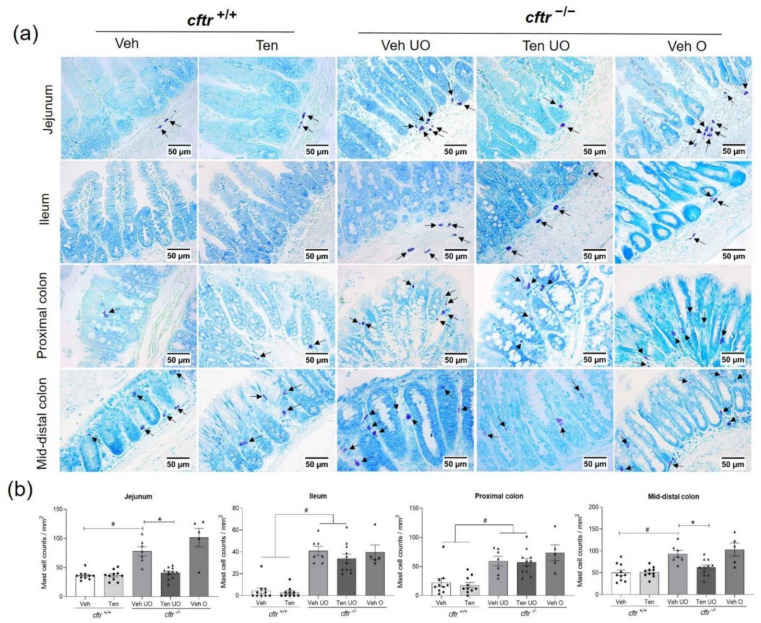
Figure 6.
Reduced numbers of mast cells in tenapanor-treated cftr−/− mice. (a) Representative images of Toluidine Blue-stained mast cells (indicated by black arrows) in the jejunum, ileum, proximal colon, and mid-distal colon in cftr+/+ and cftr−/− mice treated with either the vehicle or tenapanor. (b) Quantified mast cell counts within the selected intestinal segments. Each dot/triangle represents one mouse. Veh—vehicle, Ten—tenapanor, UO—unobstructed, O—obstructed. Data are represented as means ± SEM. # is used to represent the statistical analysis performed between the two different genotypes and * is used to represent the statistical analysis performed between the vehicle and tenapanor groups. # and *, p < 0.05.

