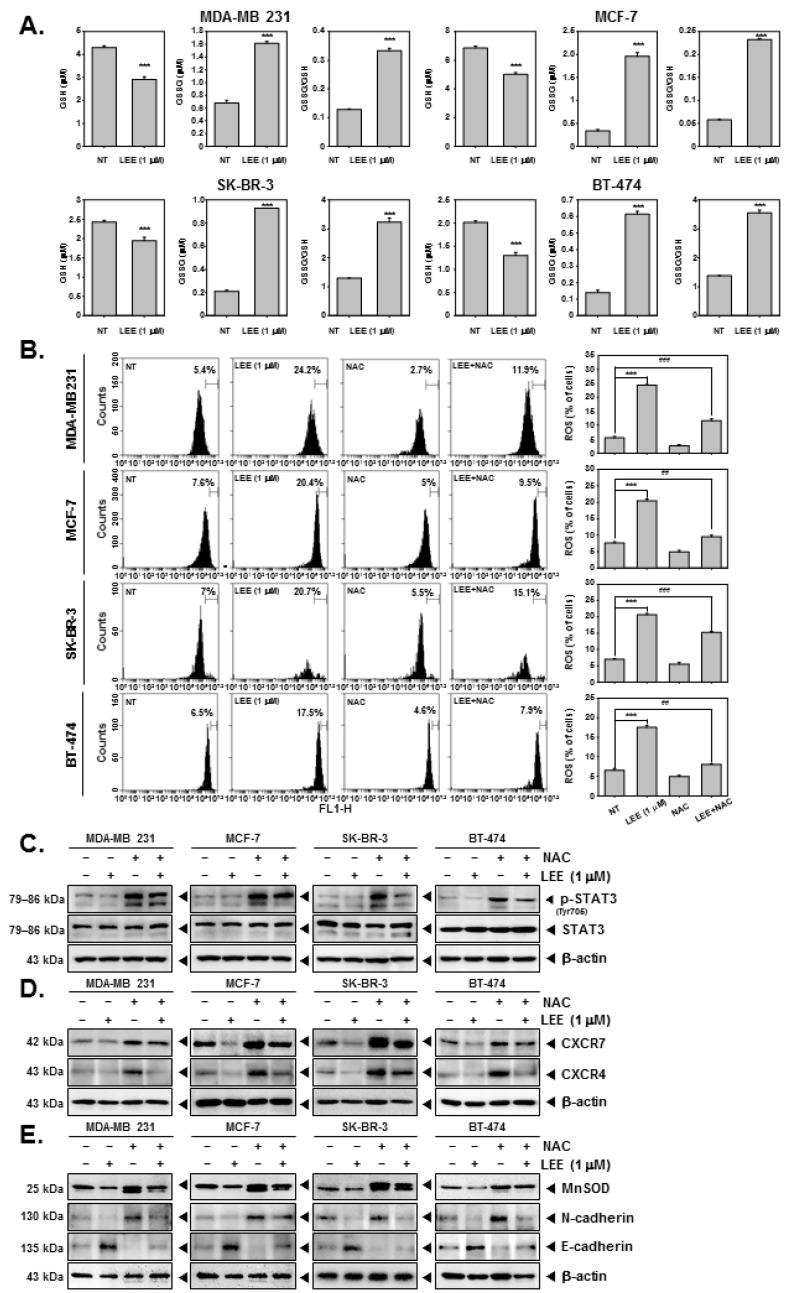
Figure 6.
Induction of GSH/GSSG imbalance and ROS production by LEE. (A) The cells were treated with LEE, and GSH/GSSG was measured by GSH/GSSG assay. (B) The cells were pre-treated with LEE for 24 h, and stimulated by N-acetyl-l-cysteine (NAC) (3 mM) for 15 min. Then, ROS production was measured by flow cytometry. (C) Whole cell lysates were analyzed by Western blot analysis. Then, p-STAT3 and STAT expression levels were confirmed. (D,E) CXCR4/7 and EMT markers were evaluated by Western blot analysis. All the experiments were individually repeated at least thrice. ### p < 0.001 vs. LEE+NAC-treated cells, ## p < 0.01 vs. LEE + NAC-treated cells, and *** p < 0.001 vs. LEE-treated cells.

