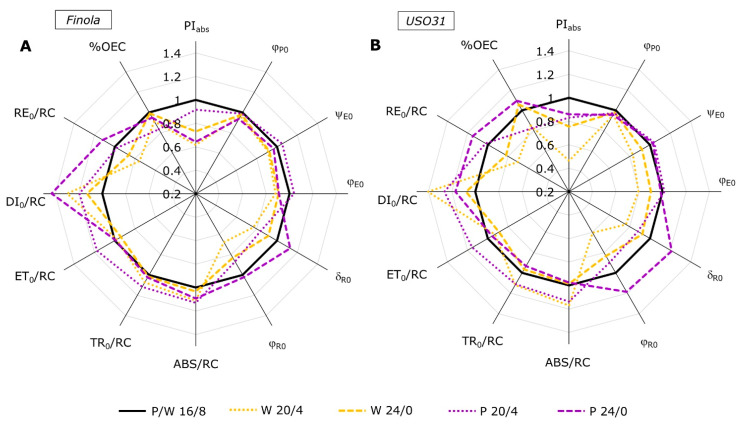
Figure 2.
Radar plot of selected JIP-test parameters characterizing PSII functioning measured in Cannabis cultivars Finola (A) and USO31 (B) exposed to 16/8, 20/4, and 24/0 photoperiods and grown under white and purple light. Data are normalized to their respective controls measured at the 16/8 photoperiod for each cultivar and growth light separately (control = 1). Each curve represents mean values of 5 measurements (n = 5); LSDFinola = 0.019; LSDUSO31 = 0.008.

