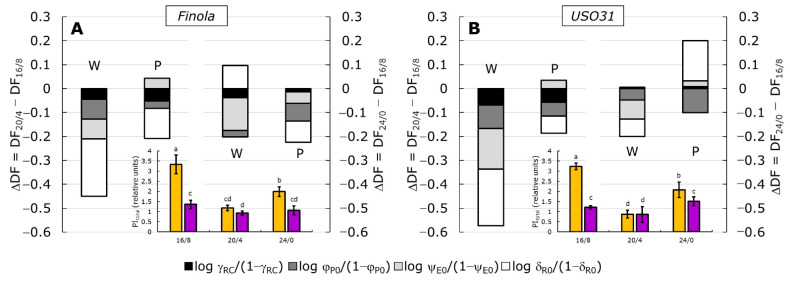
Figure 4.
Relative changes in the difference in driving forces (ΔDF) measured in Cannabis cultivars Finola (A) and USO31 (B) exposed to 16/8, 20/4, and 24/0 photoperiods and grown under white (W) and purple (P) light. Stacked columns are showing the difference in DFs at 20/4 (left columns per panel) and 24/0 (right columns per panel) photoperiods minus the DF at 16/8 (control). Each DF is calculated by summing up their partial driving forces: log γRC/(1 − γRC), log φP0/(1 − φP0), log ψE0/(1 − ψE0), and log δR0/(1 − δR0). The performance index for energy conservation from exciton to the reduction of the final electron acceptor at PSI, PItotal for each cultivar is shown in the inserts. Yellow bars represent plants grown under white light, while purple bars represent plants grown under purple light. Results are shown as the mean of five independent measurements (n = 5) ± SD. Different letters represent a significant difference at p ≤ 0.05 (ANOVA, LSD).

