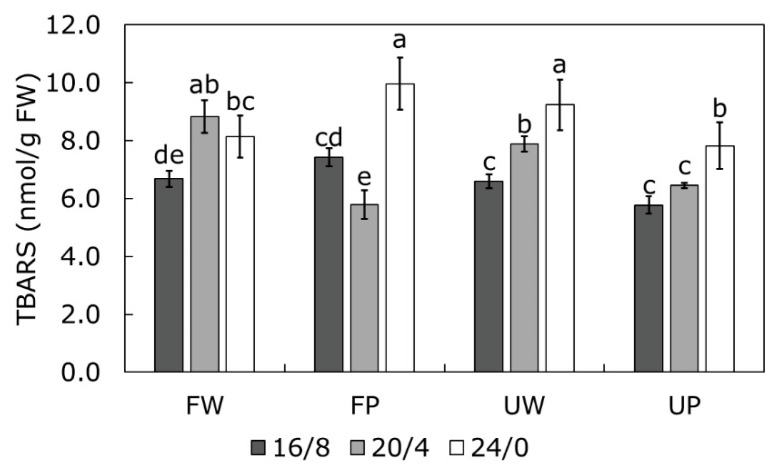
Figure 5.
Changes in content of thiobarbituric acid reactive substances (TBARS, nmol/g FW) measured in Cannabis cultivars Finola (F) and USO31 (U) exposed to 16/8, 20/4, and 24/0 photoperiods and grown under white (W) and purple (P) light. Results are shown as mean of five independent measurements (n = 5) ± SD. Different letters represent significant differences at p ≤ 0.05 (ANOVA, LSD); LSD = 0.187.

