
Figure 4.

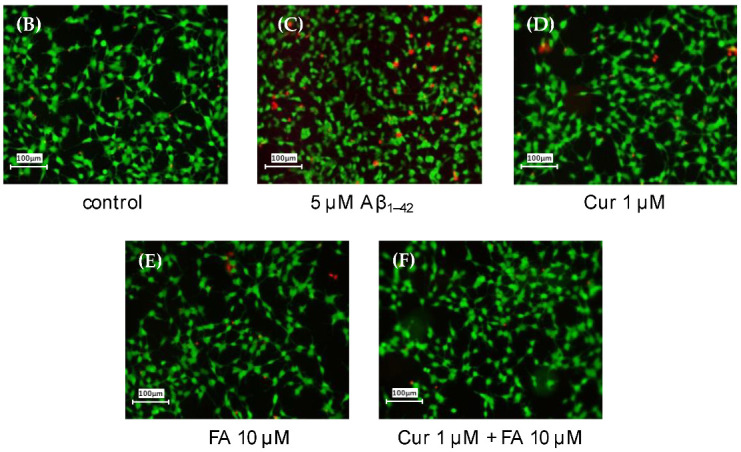
Effect of Cur, FA, or a combination of both on the cytotoxicity in Aβ1–42-stimulated SH-SY5Y cells. The cytotoxicity in Aβ1–42-stimulated SH-SY5Y cells was evaluated using EthD-1 Cell assay. (A) The cytotoxicity of SH-SY5Y cells exposed to 5 µM Aβ1–42 and treated with Aβ1–42 + 1 µM Cur, Aβ1–42 + 10 µM FA or Aβ1–42 + 1 µM Cur + FA. (B–E) Fluorescence microscopic images in SH-SY5Y cells were acquired using an inverted fluorescence microscope. (B) Untreated SH-SY5Y cells; (C) SH-SY5Y cells exposed to 5 μM Aβ1–42; (D) SH-SY5Y cells treated with 5 μM Aβ1–42 + 1 μM Cur; (E) SH-SY5Y cells treated with 5 μM Aβ1–42 + 10 μM FA; (F) SH-SY5Y cells treated with 5 μM Aβ1–42 + 1 μM Cur + 10 μM FA. The scale bar represents 100 µm. +: inclusion of 5 μM Aβ1–– 42, 1 μM Cur, 10 μM FA, respectively, −: non-inclusion. The p-values in ANOVA were < 0.001. Each value expresses the mean + S.E.M. of at least 3 independent experiments. In the absence of 5 μM Aβ1–42, cytotoxicity of control, 1 μM Cur, 10 μM FA and Cur + FA-treated cells were 10.48 ± 0.52, 10.21± 1.54, 10.27 ± 2.06 and 10.30 ± 1.73% (no significant difference, n = 6, Tukey). #, p < 0.0001 for Aβ1–42 exposed cells versus the other treated cells (n = 6, Tukey); *, p <0.05 for Aβ1–42 + Cur + FA-treated cells versus Cur-treated cells (n = 6, Tukey).