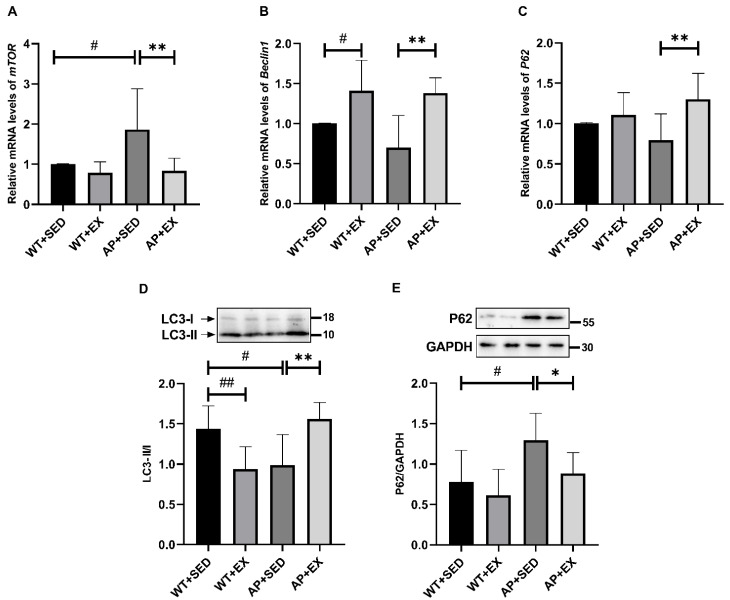
Figure 5.
Exercise regulated autophagy in mouse brain tissue. The relative expression levels of (A) mTOR, (B) Beclin1, and (C) P62 mRNA in brain tissue were measured by RT-PCR (n = 5). Relative protein levels of (D) LC3-II/I and (E) P62 in brain tissue (n = 6). Data are presented as means ± SDs. # p < 0.05, ## p < 0.01 vs. WT + SED mice, * p < 0.05, and ** p < 0.01 vs. AP + SED mice.

